Chemical Dispersion Modeling Website
Background
This project was outsourced by an emergency response agency, which often provides technical support on environmental hazards. According to the client's description, they have been using a chemical dispersion modeling software on hazard analysis for years, but they were hoping to transform it into an online version to make the analyzing jobs more flexible.
Team
- Project Lead
- UI / UX Designer
My Role
- Chang Ting Wei (Front-end engineer)
- Frank Lin (Back-end engineer)
Collaborate With
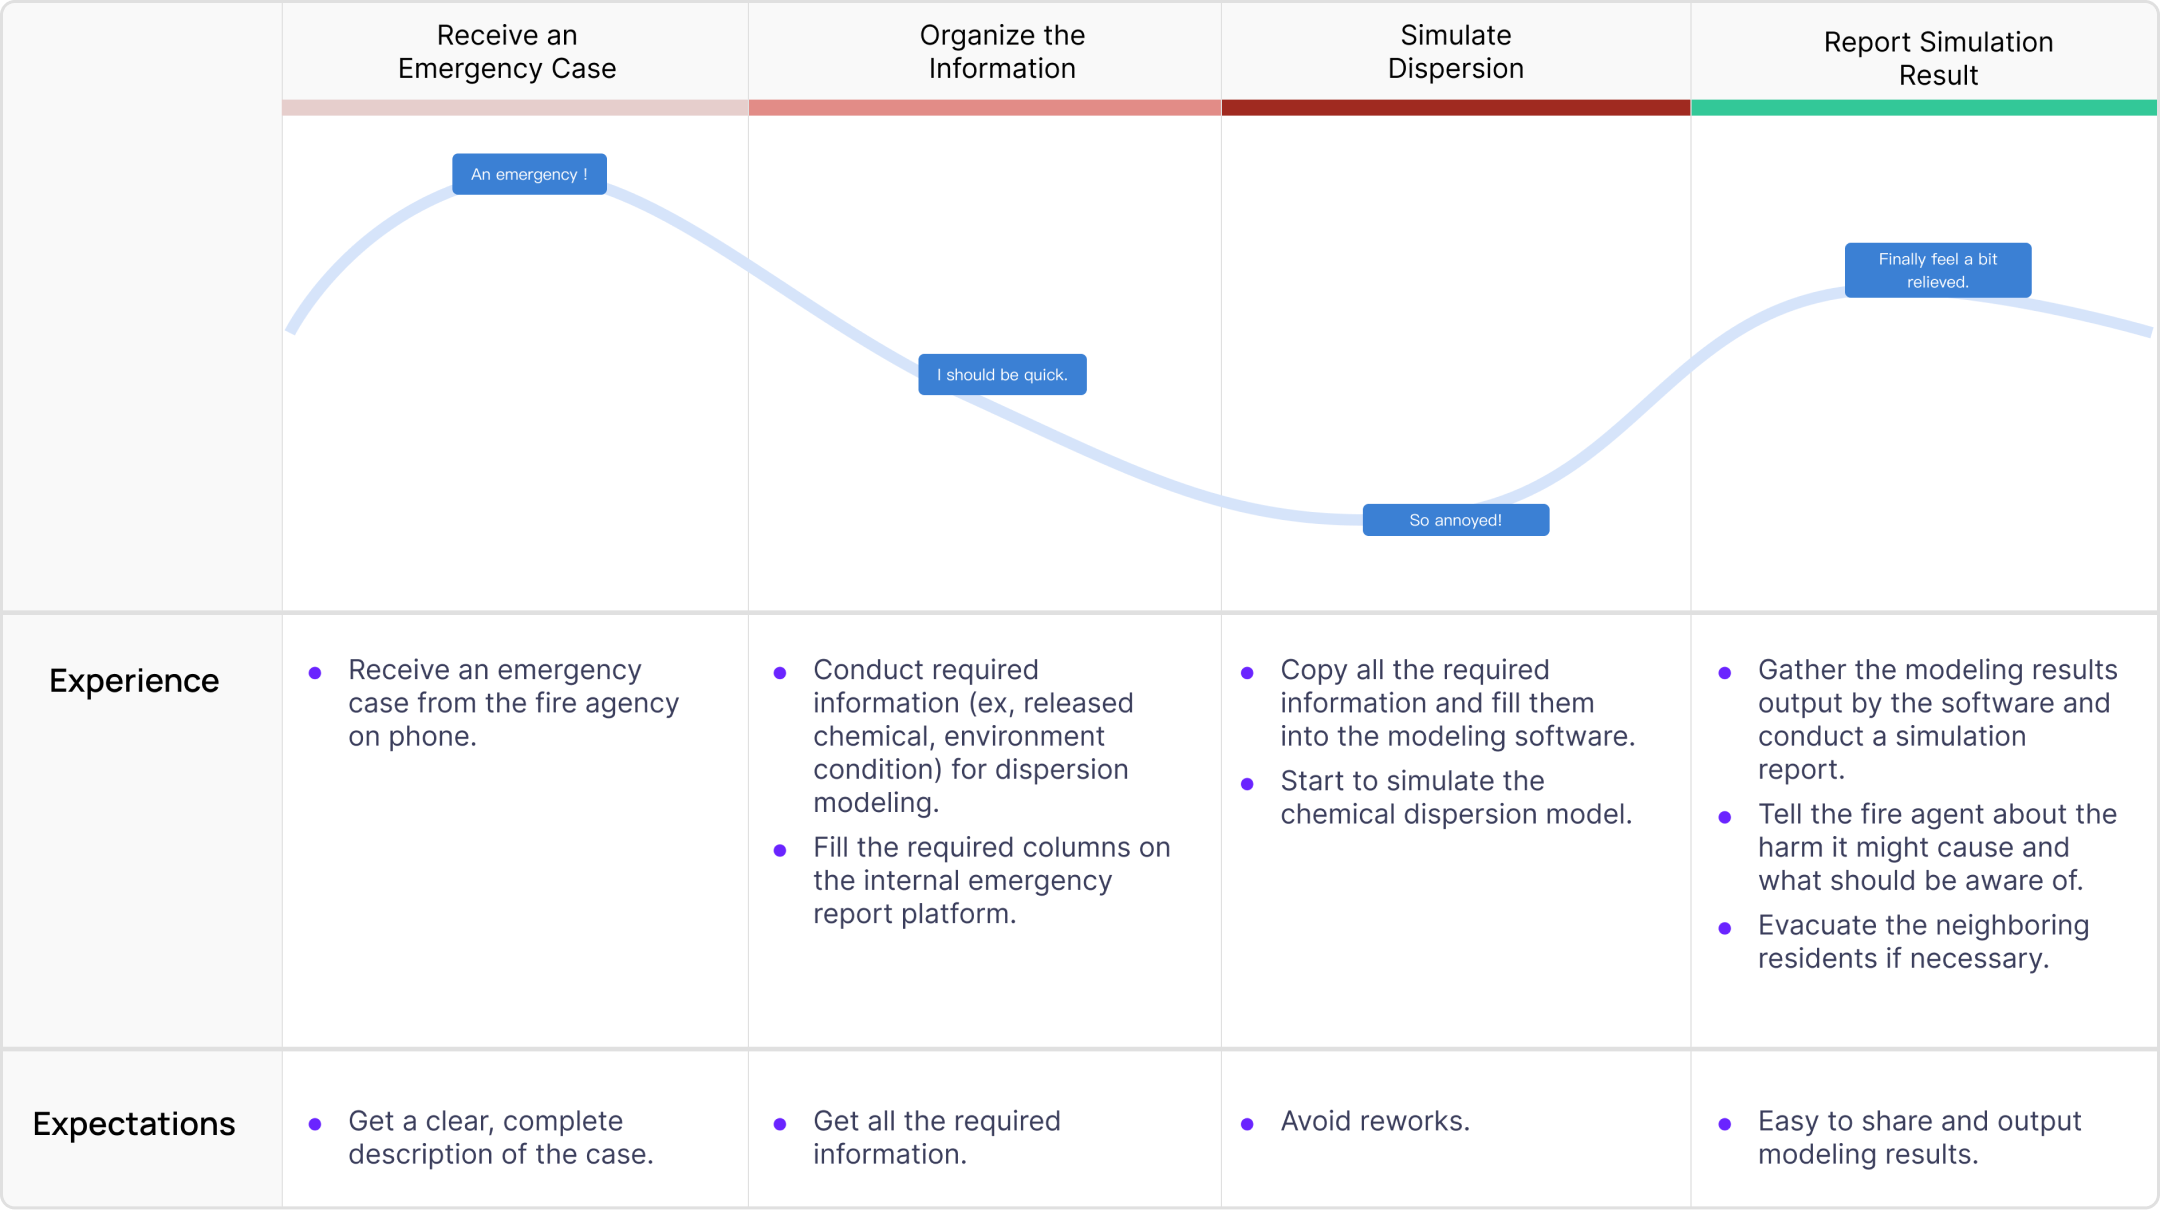
Understand - User Journey
I mapped a user journey based on the interviews with our client. The process was complex and may be difficult for the outsiders to understand, but I did find out the users' pain points:
“The pain of reworks on using the modeling software.”
Define Problems
Continued by the user journey above, it was easy to find out several reasons why the client wanted to transform the dispersion modeling software into an online version:
Unlike local software, a web can be opened on almost any device. In that way, our clients do not need to bring a laptop everywhere, especially when dealing with urgent cases.
Once the web and its APIs are developed, its application level can be diverse. For example, we can connect the web data into the system our clients were currently using.
In the original software, all the modeling results need to be stored in a specific file format, which is inconvenient to share and manage. However, in the web version, all the results and setting changes can be saved immediately, or even be shared with other users.
Project Backlogs
Wireframe and Prototyping
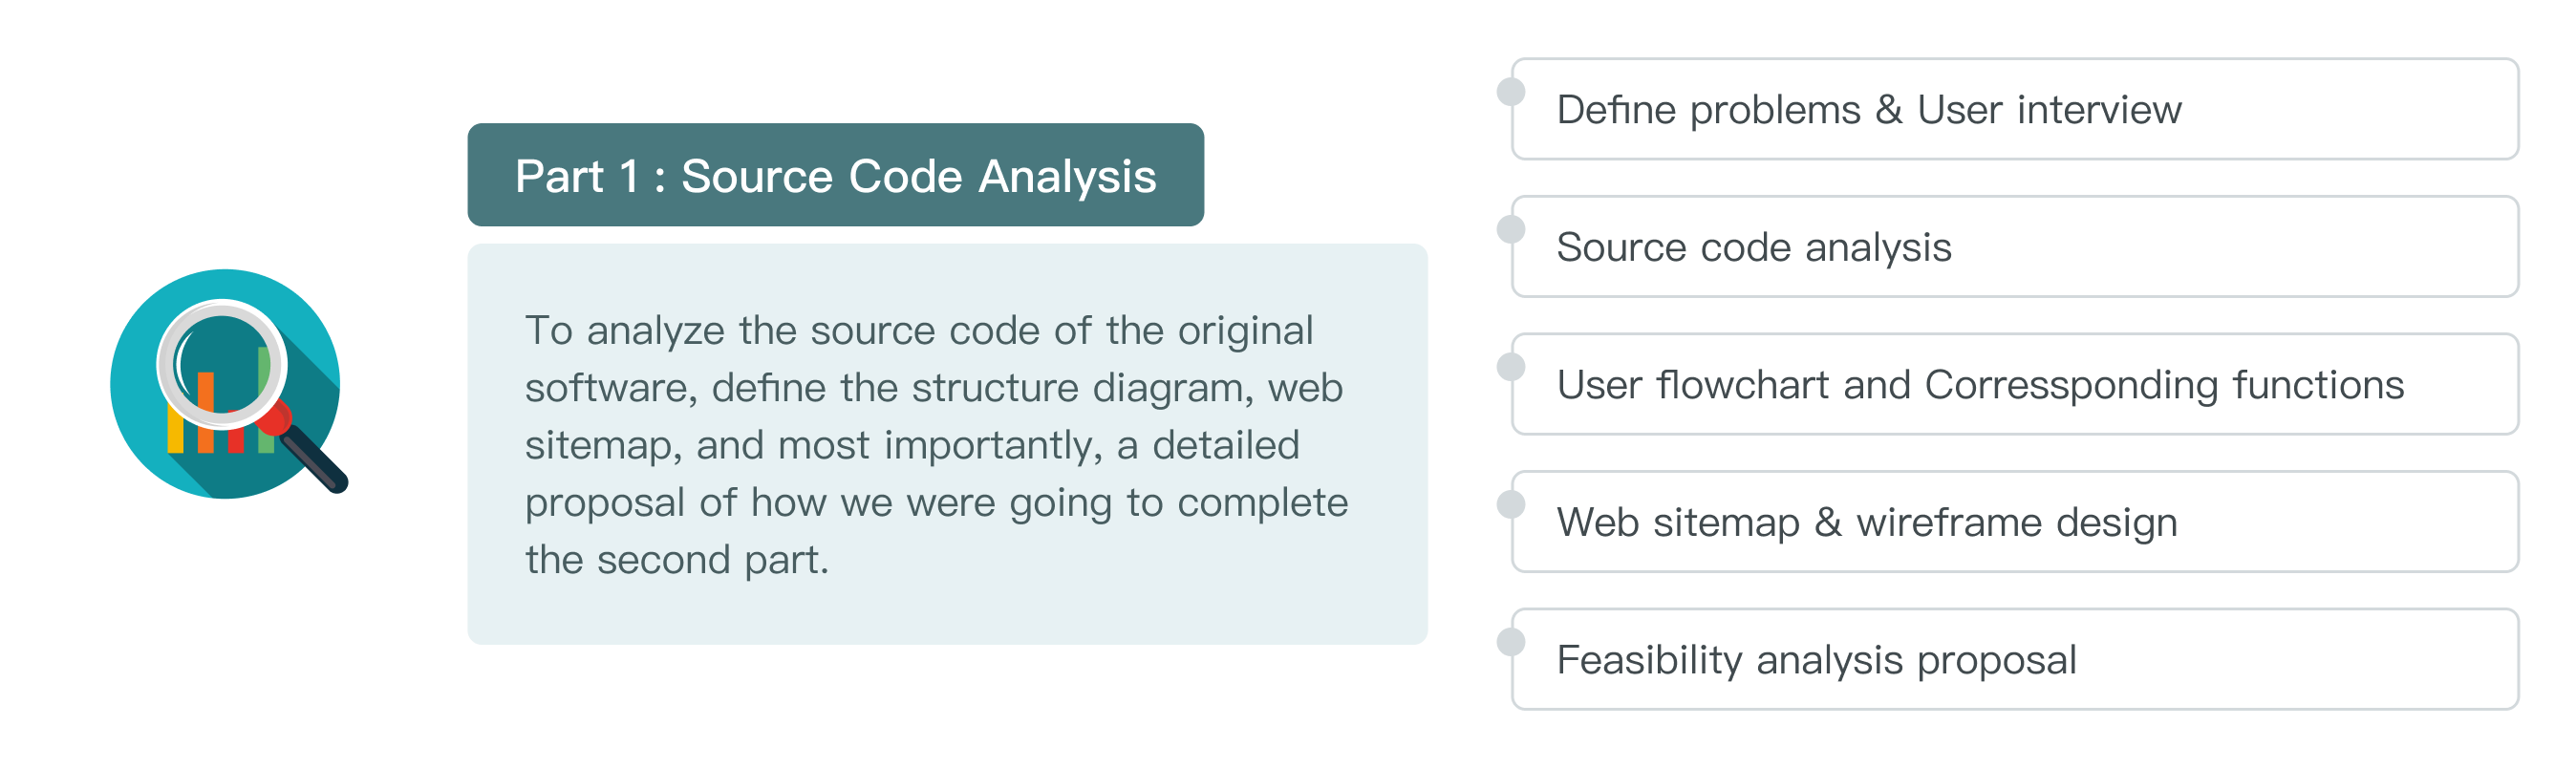
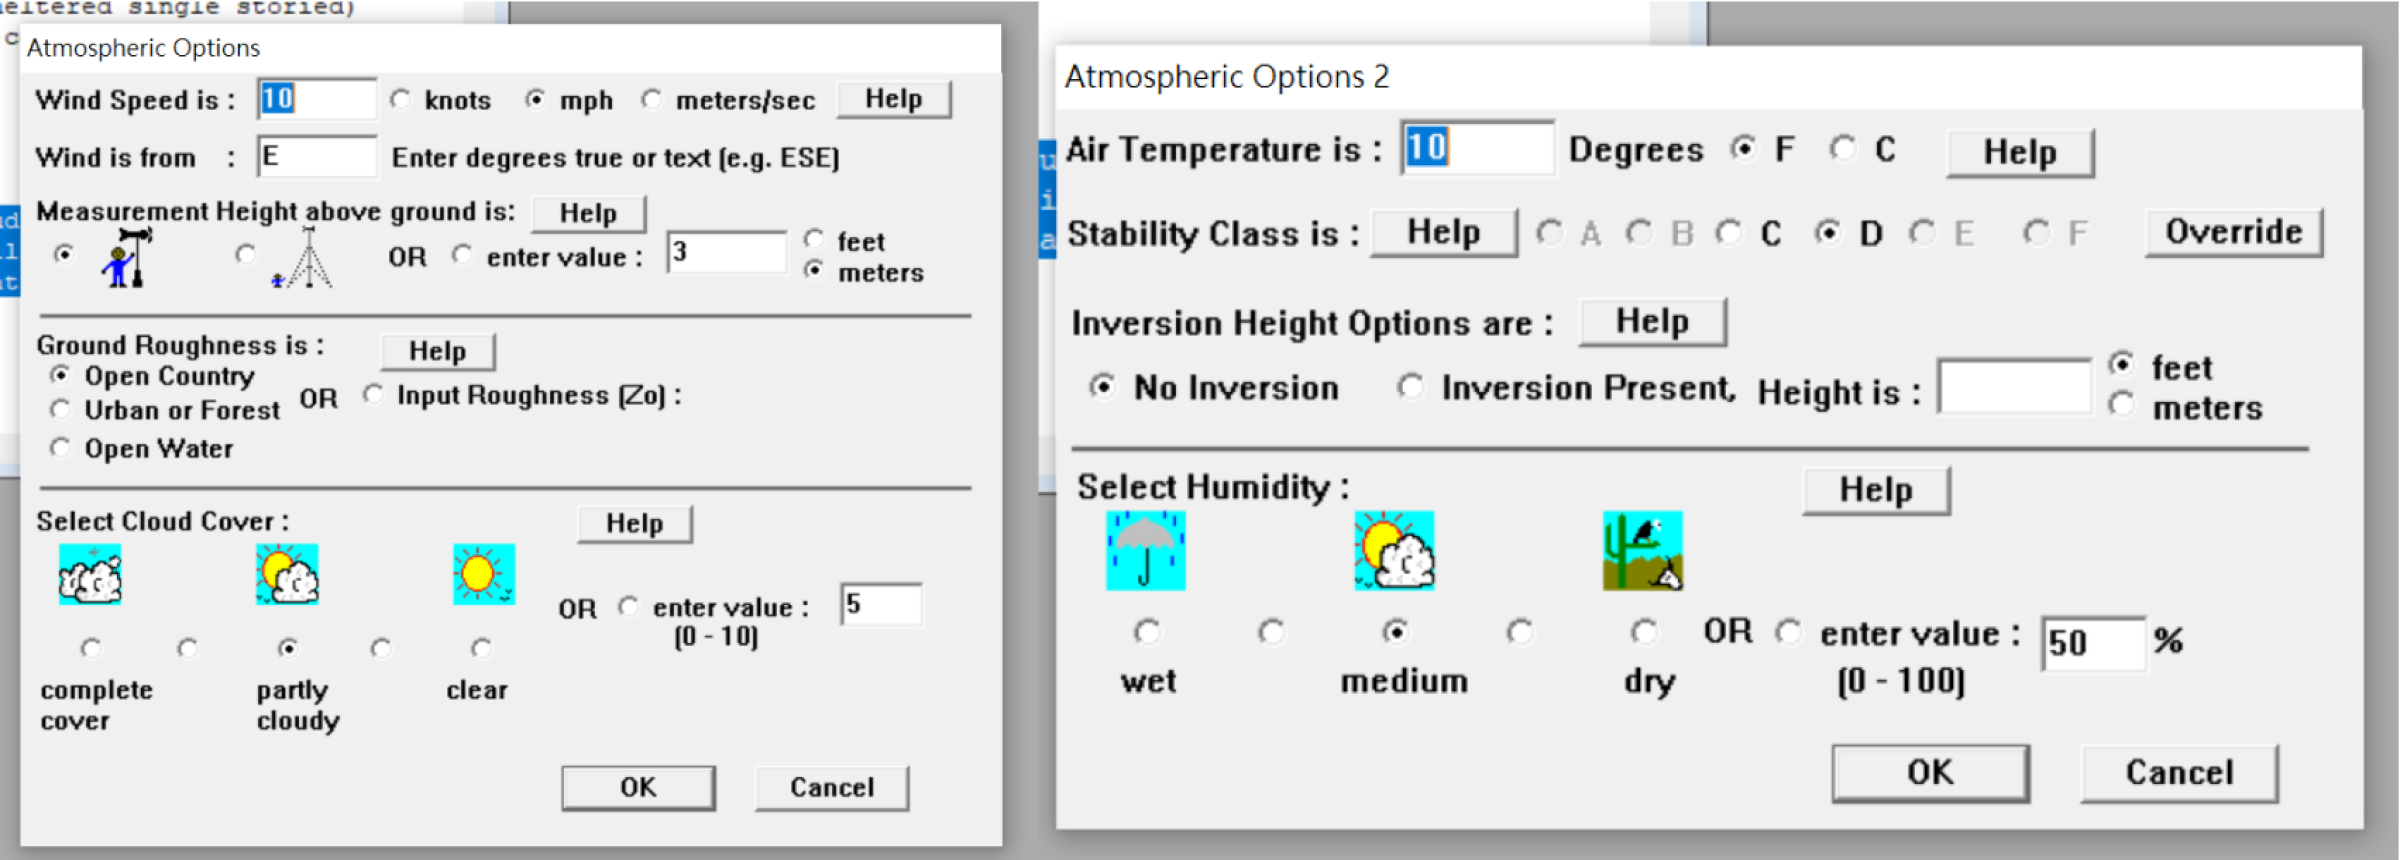
Flowchart of the original software
As the client had been using the original software for a long time, it was essential to understand the existing user flow. Together with the engineers, we organized the user flowchart and added the corresponding source code functions for a more comprehensive analysis.
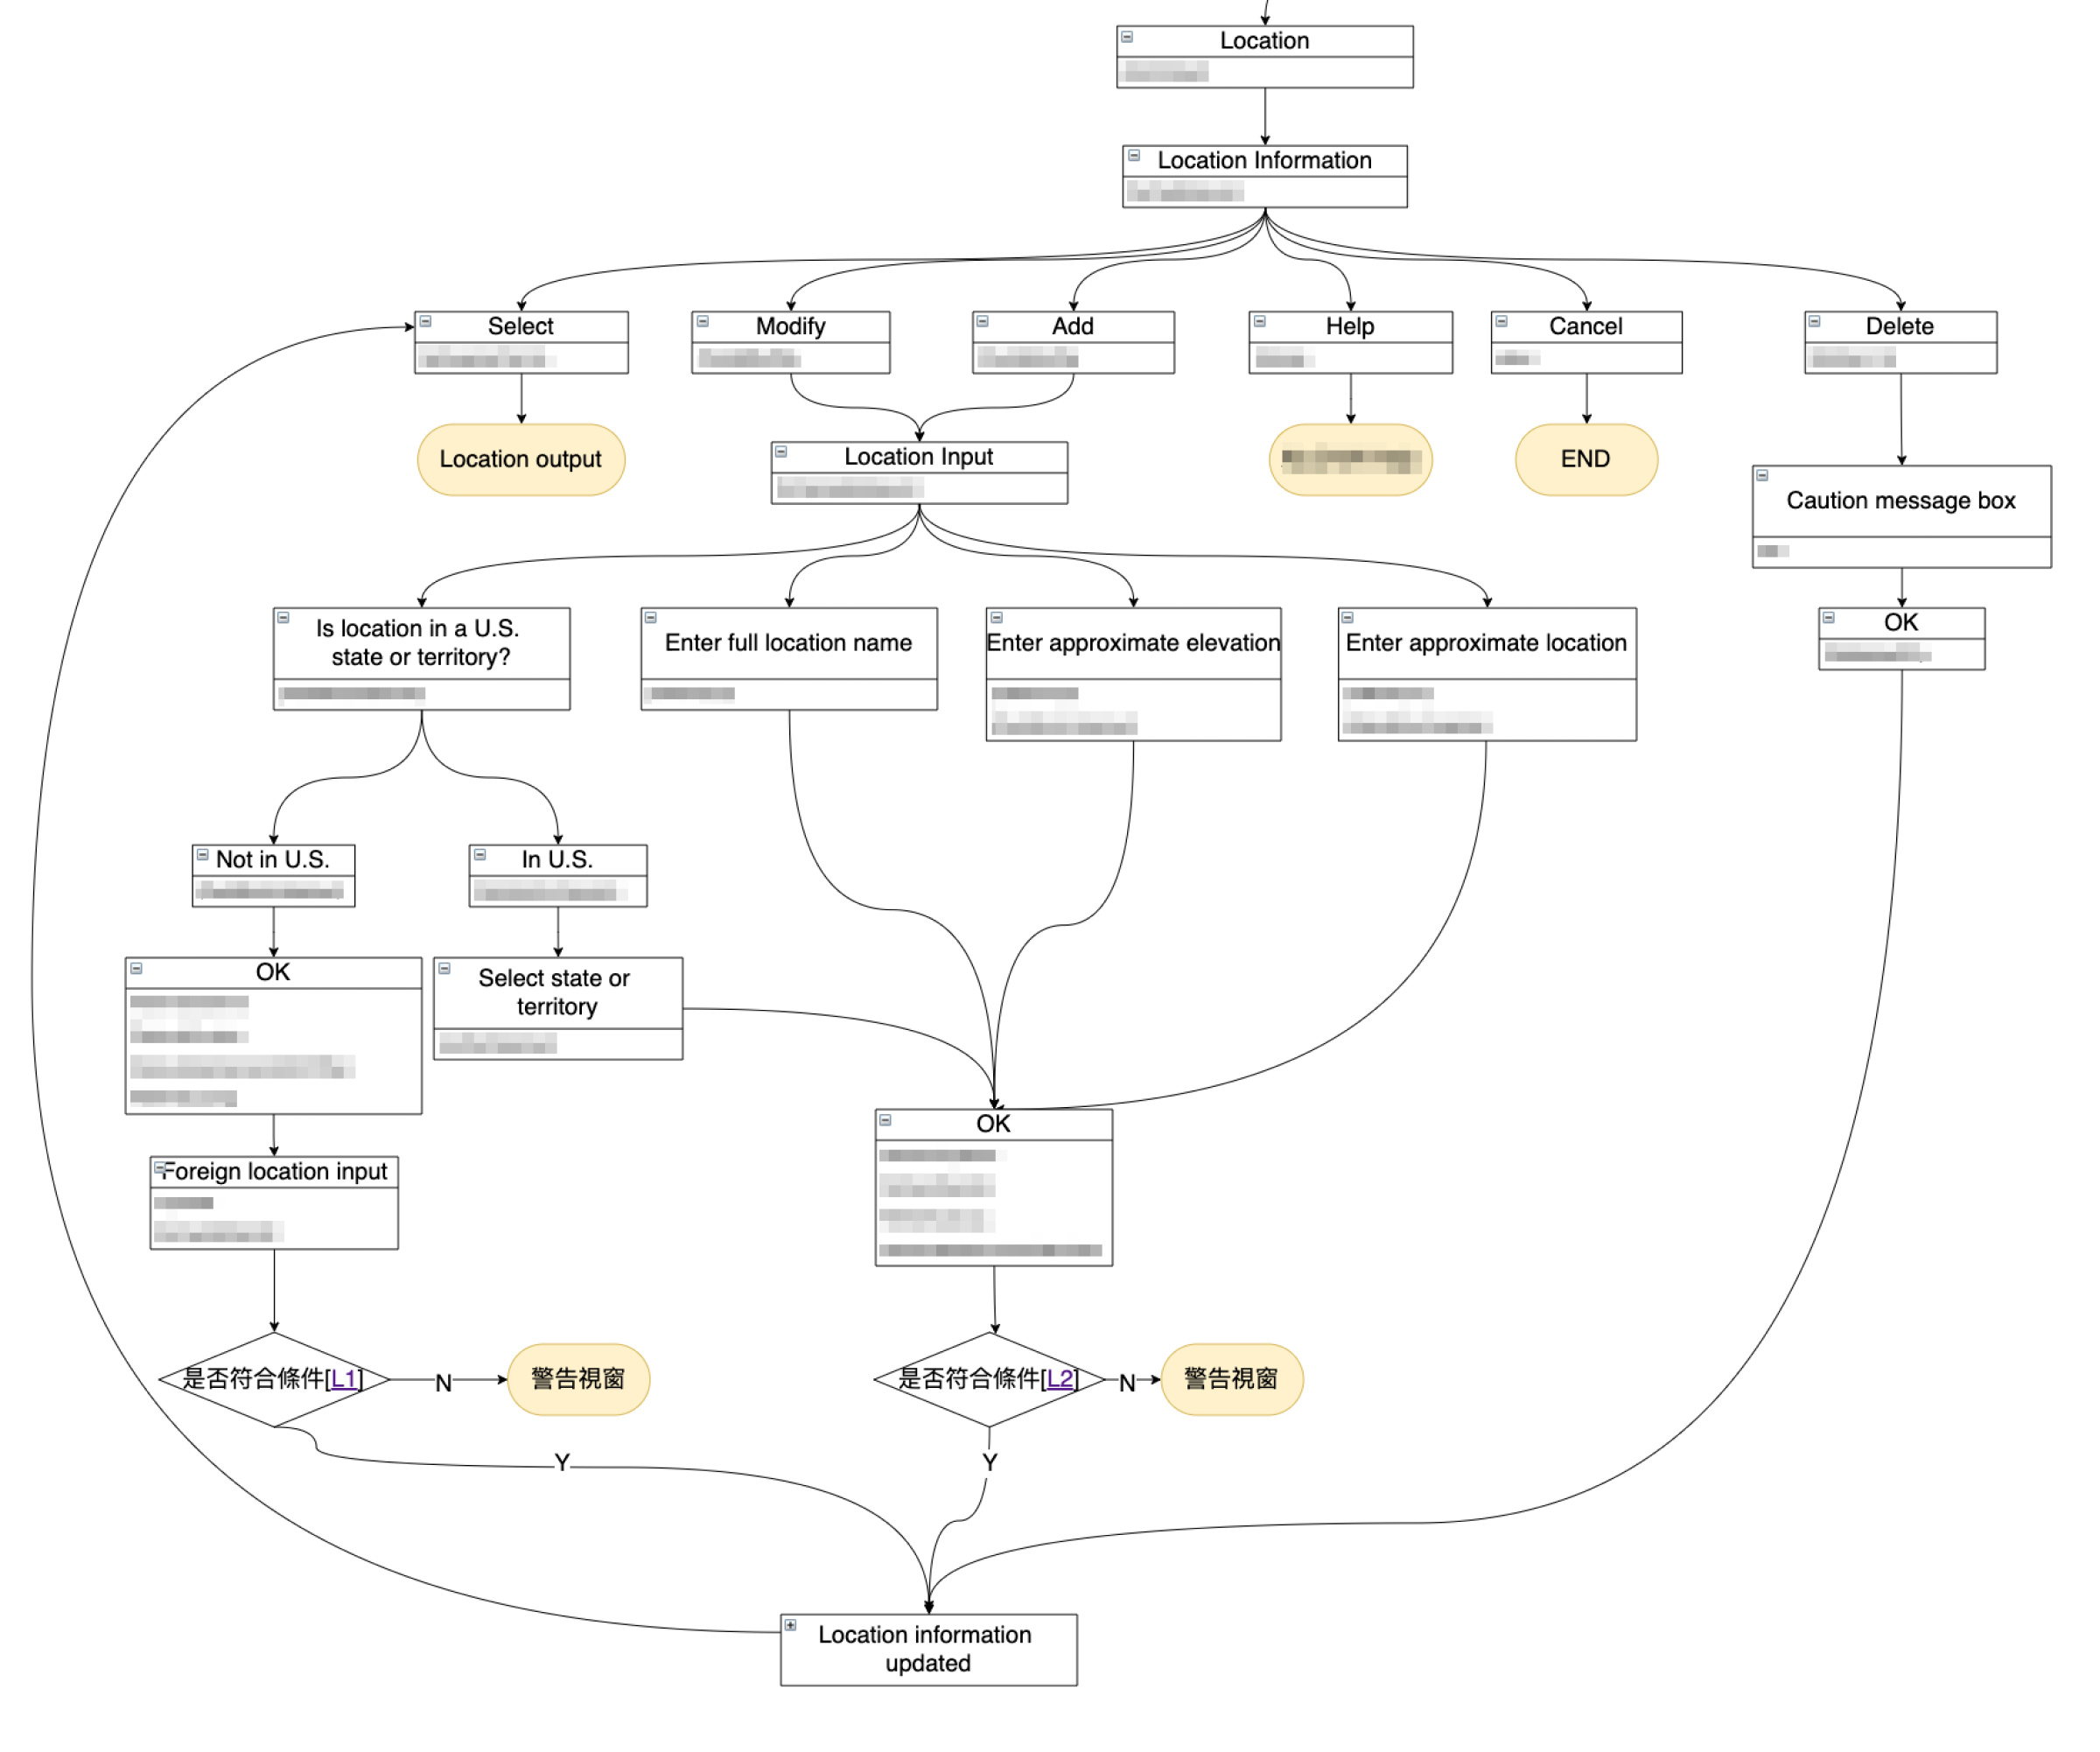
A small piece of the flowchart with sensitive information hided.
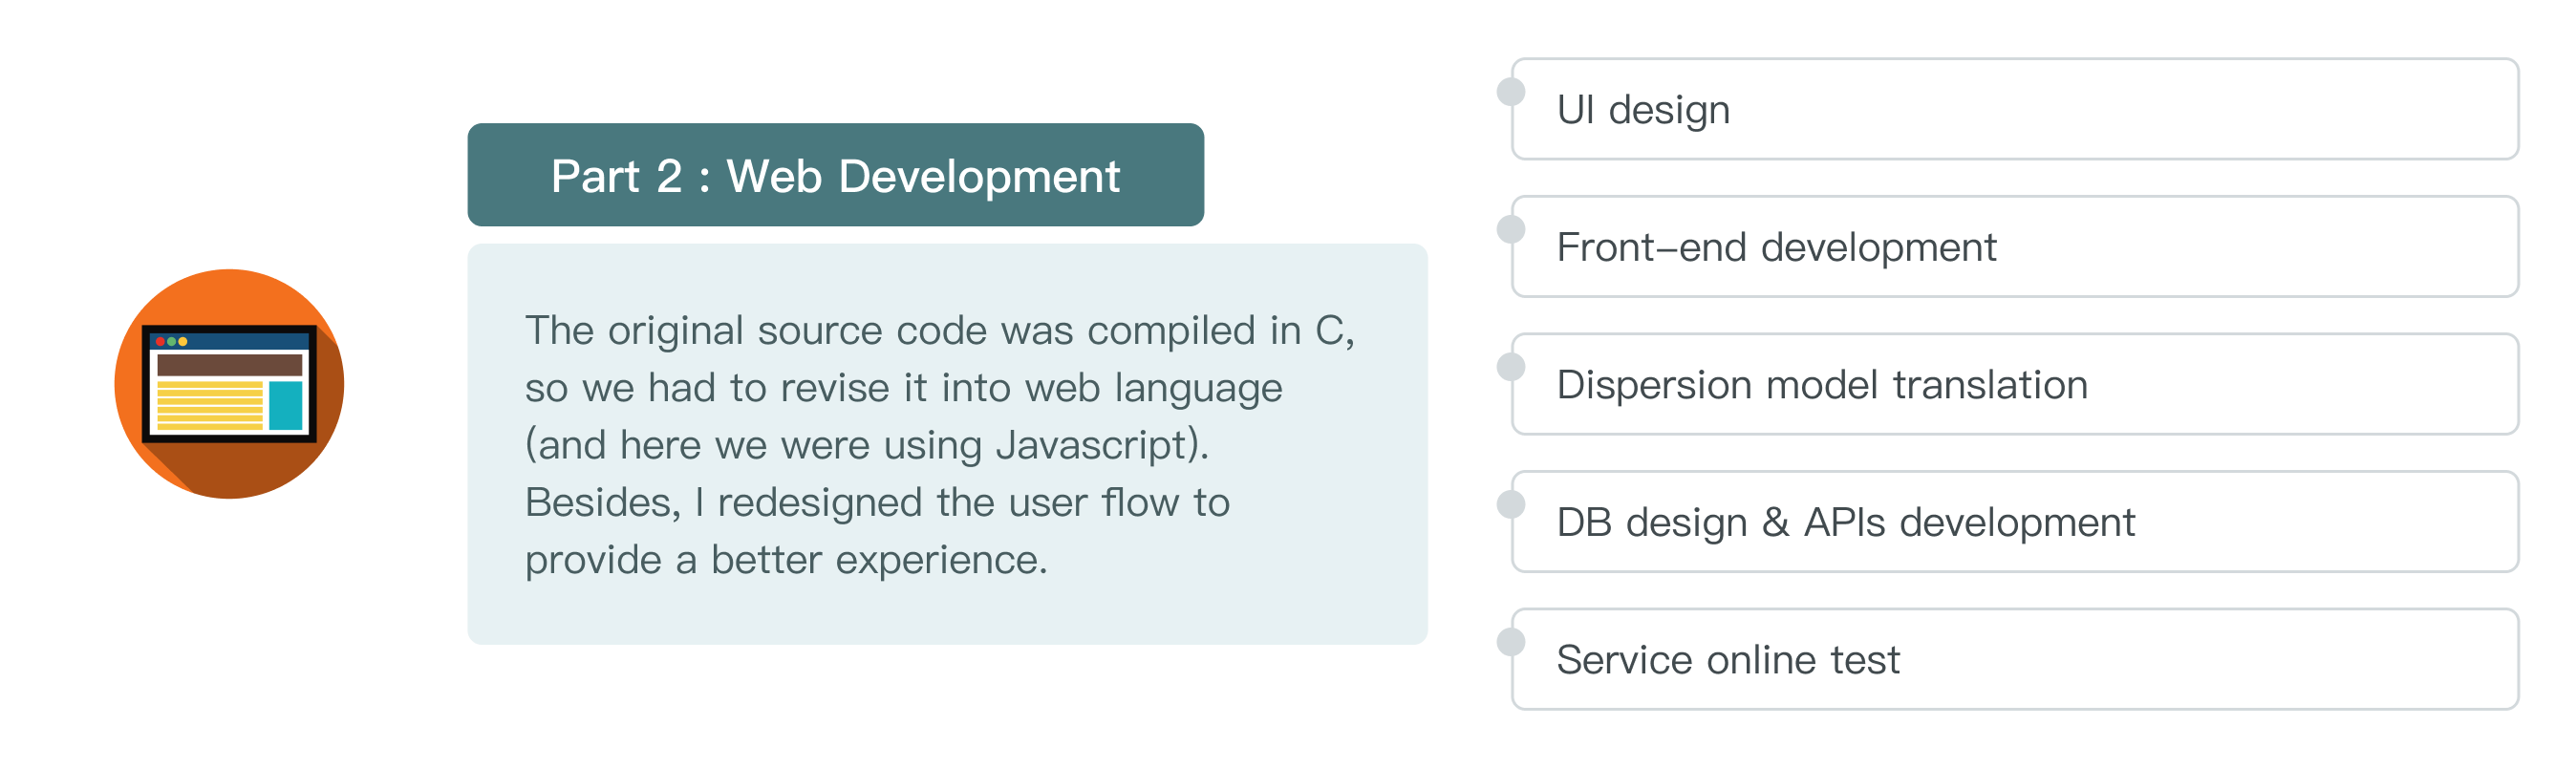
The New Web Sitemap
To create a better experience and maintain the core functions of the original software at the same time, I tried to imitate the existing user flow but to optimize some complex processes so that it could be more simple for both users and developers.
For example, the functional map of the original software is quite complicated, so I redesigned the process into 5 main steps, which would be easier to use and develop.
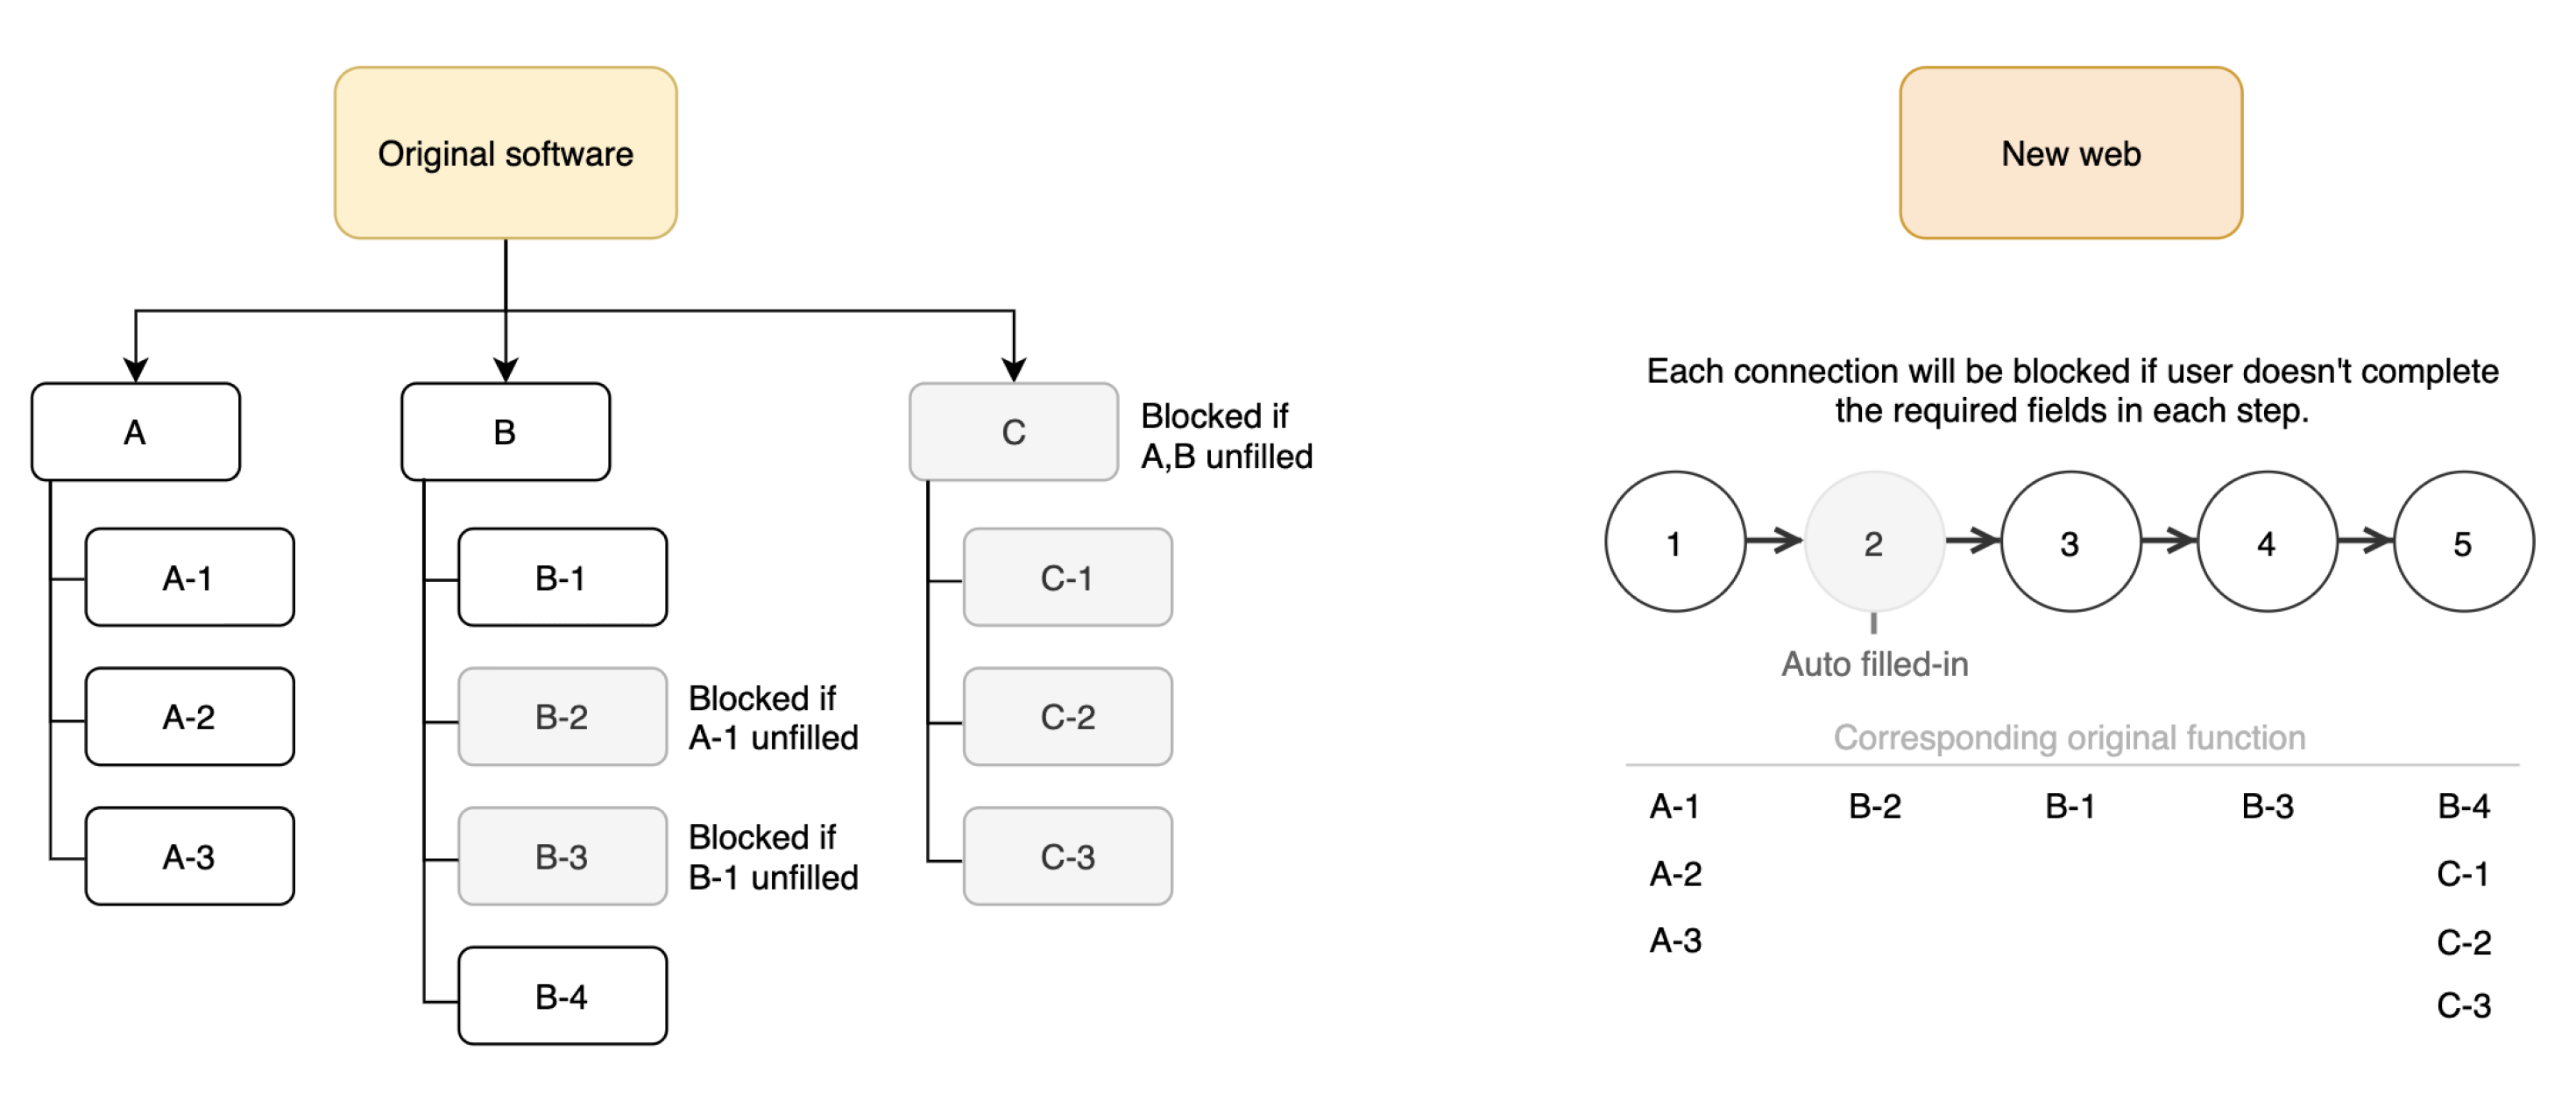
The functional map comparison between 2 systems.
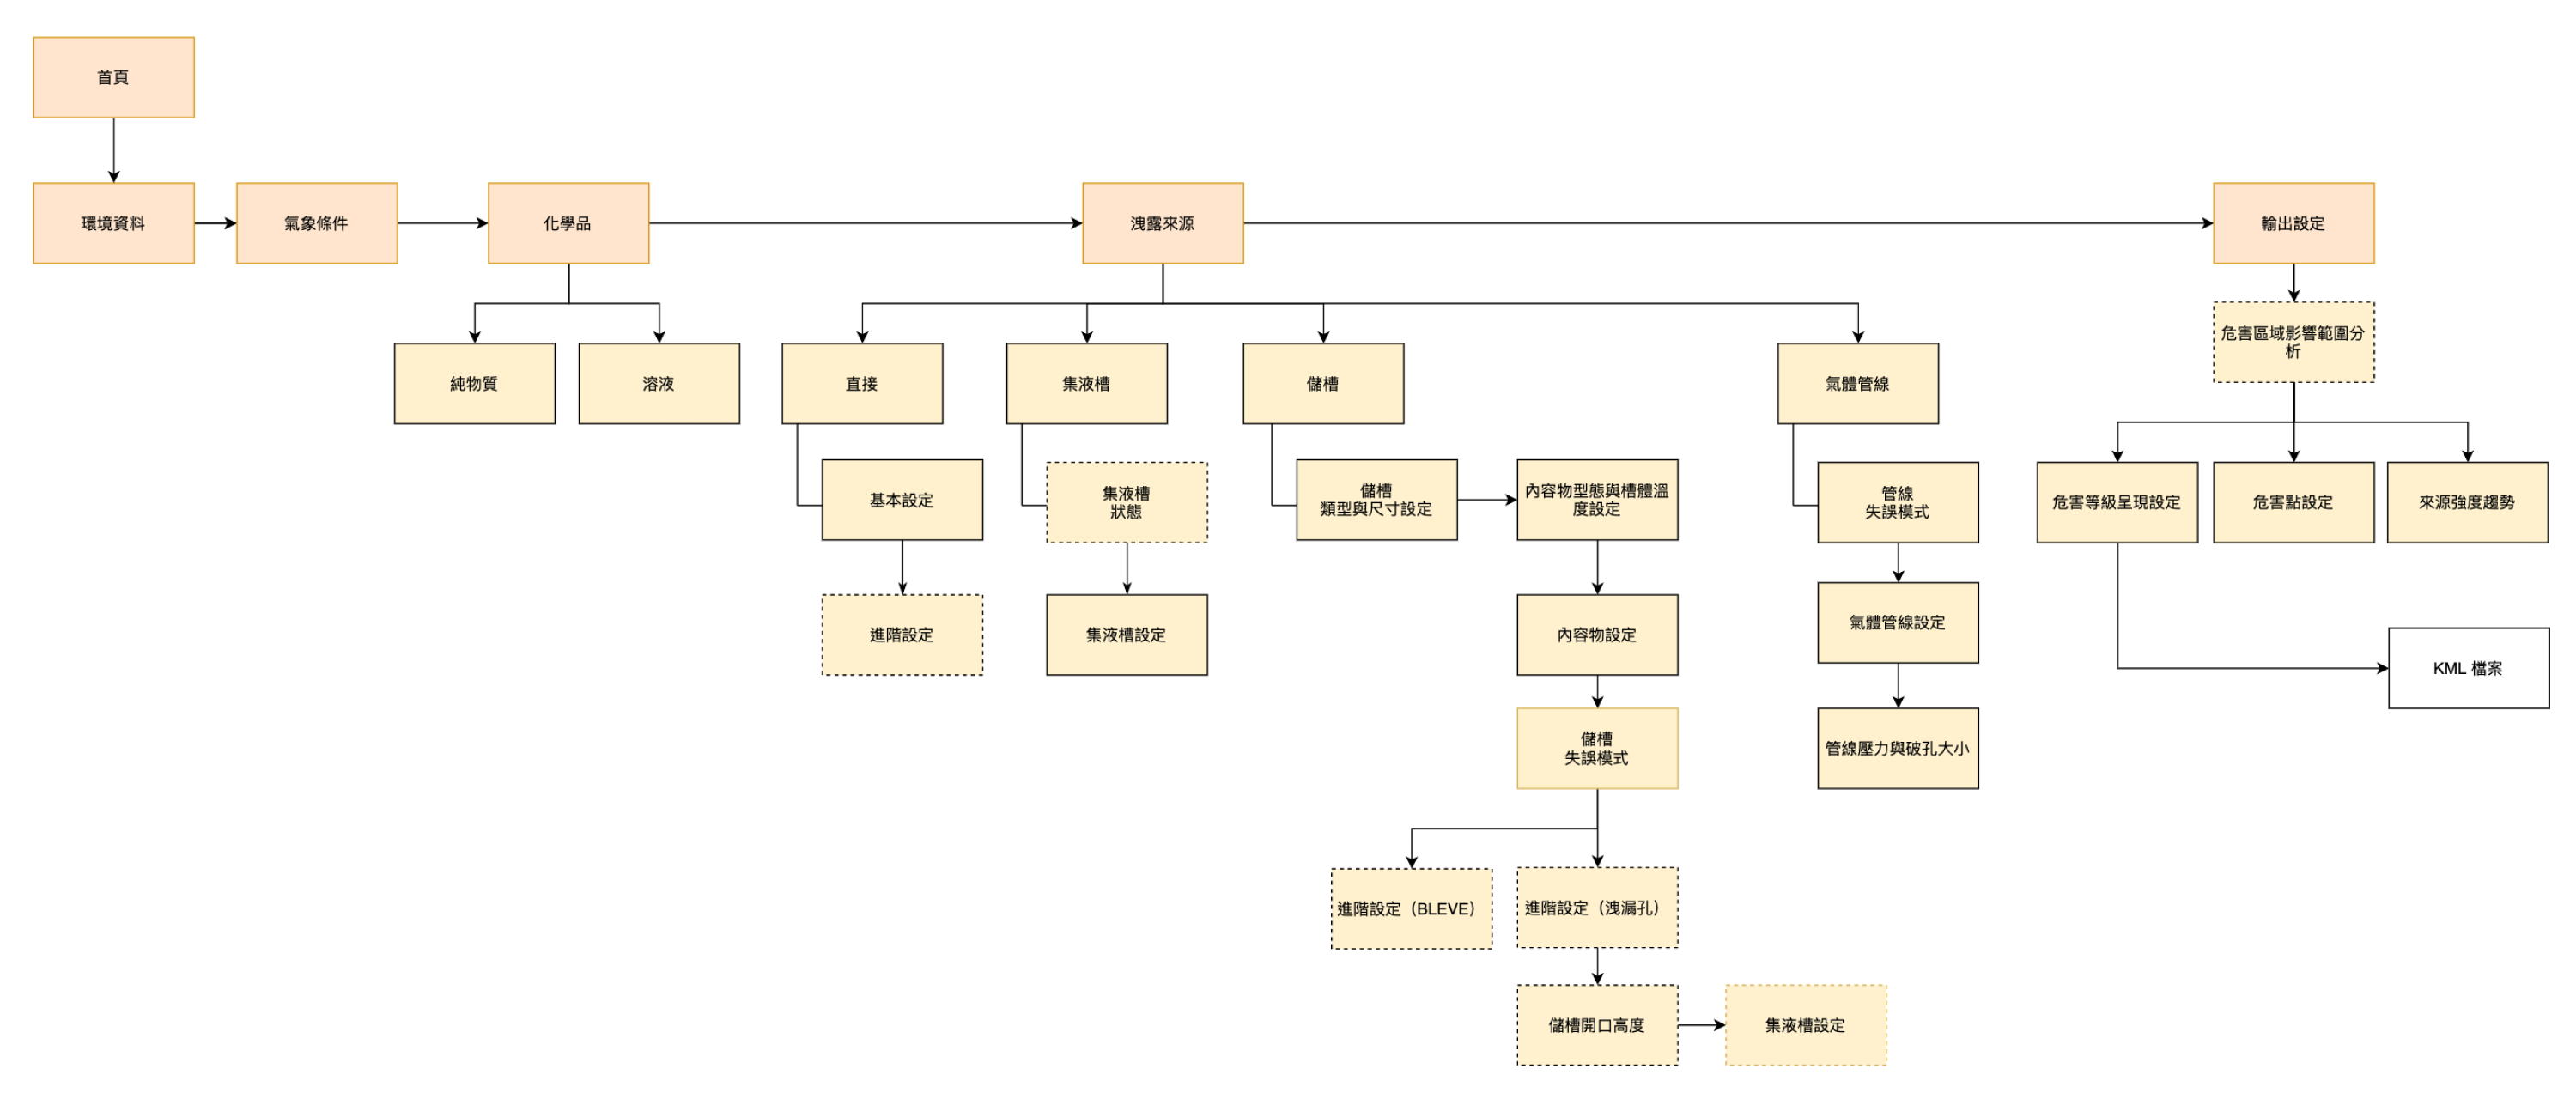
A simplified sitemap of the web.
Wireframe
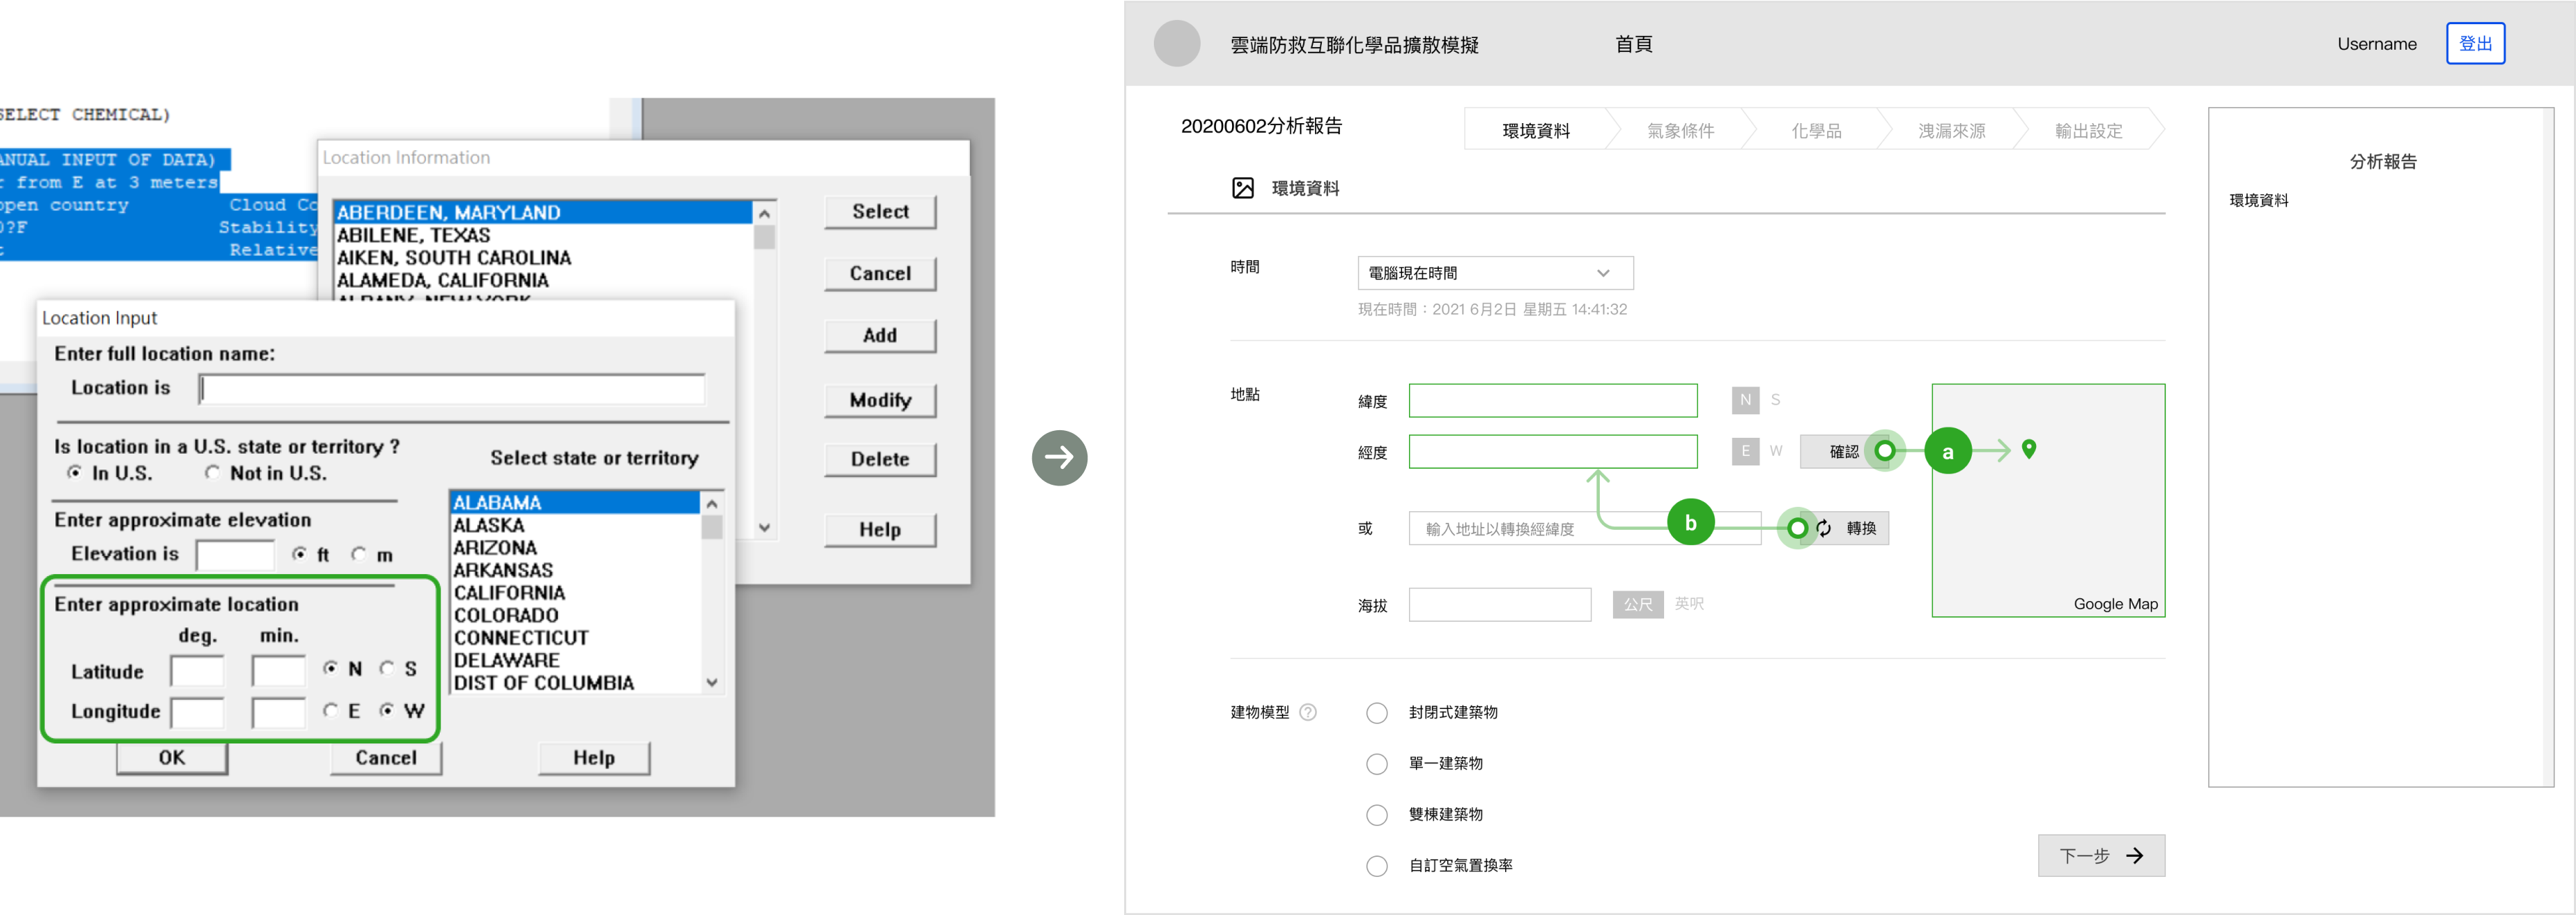
- Environment Setup
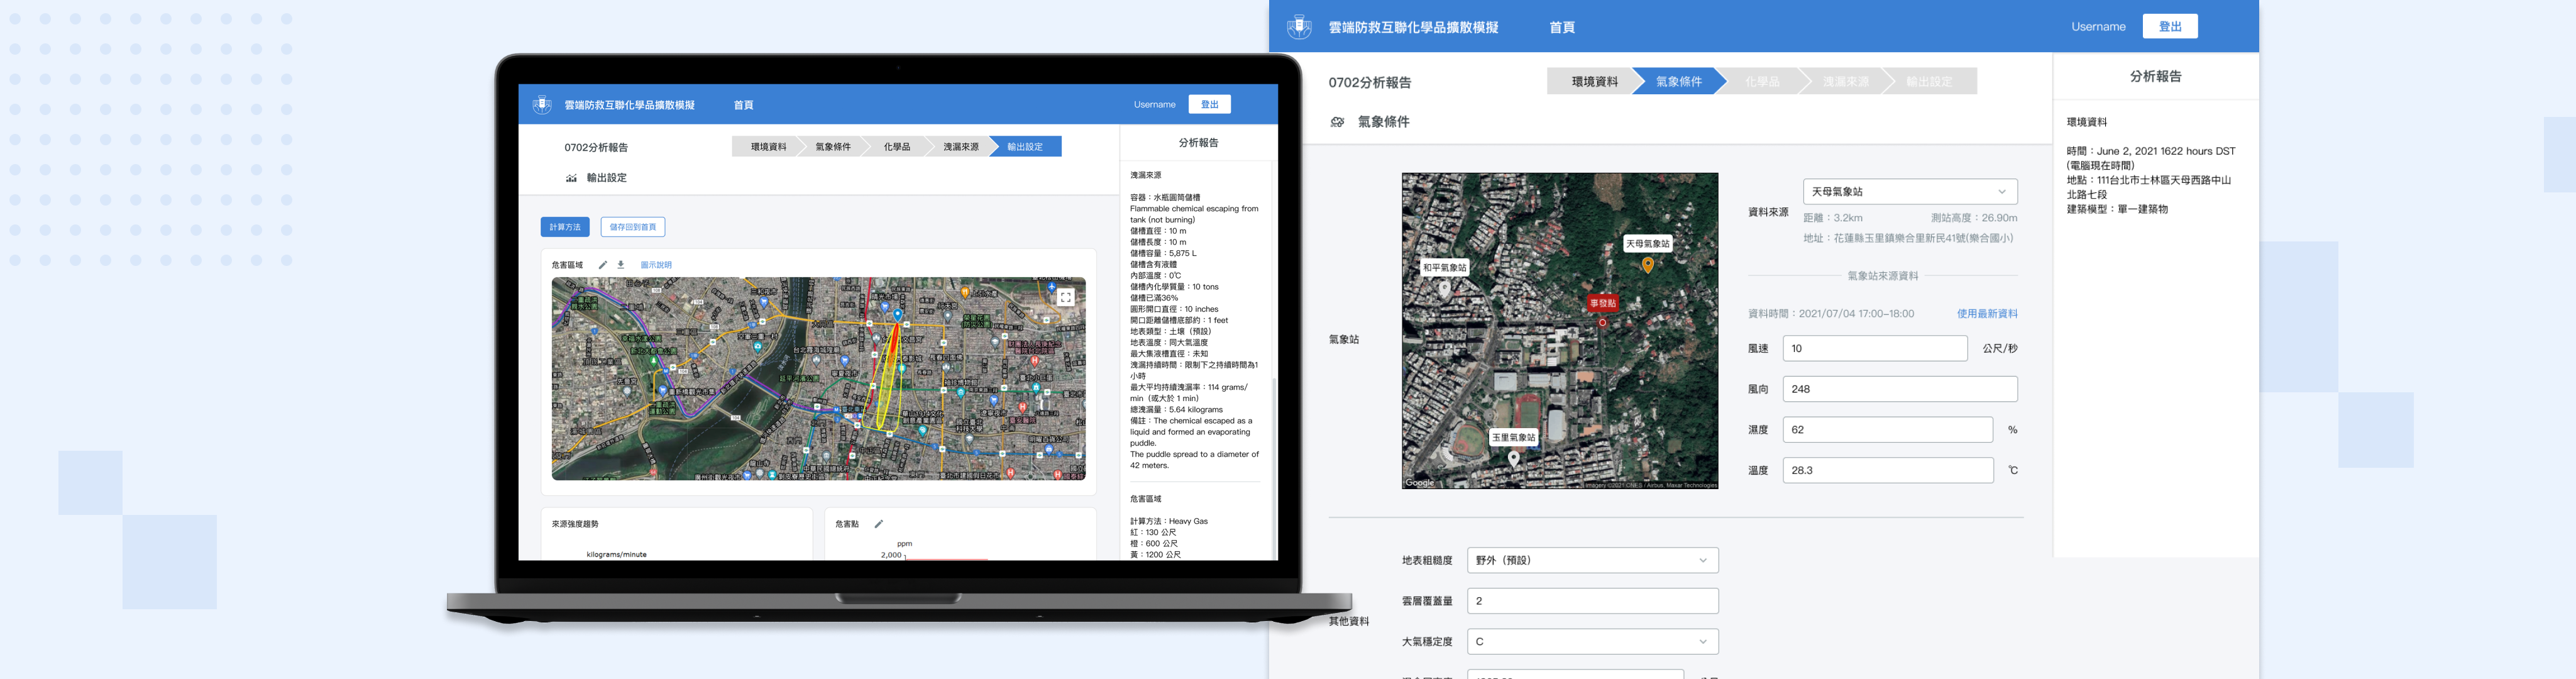
In the original software, users can only input Longitude and Latitude Information, and they even have to input almost the same data again when stimulating the chemical dispersion. Therefore, after some iterations with our client, we embedded the Google Map preview (a) and added an address column so that system can directly transform the address into Longitude and Latitude (b).
In the visual design phase, this user flow would be further improved.
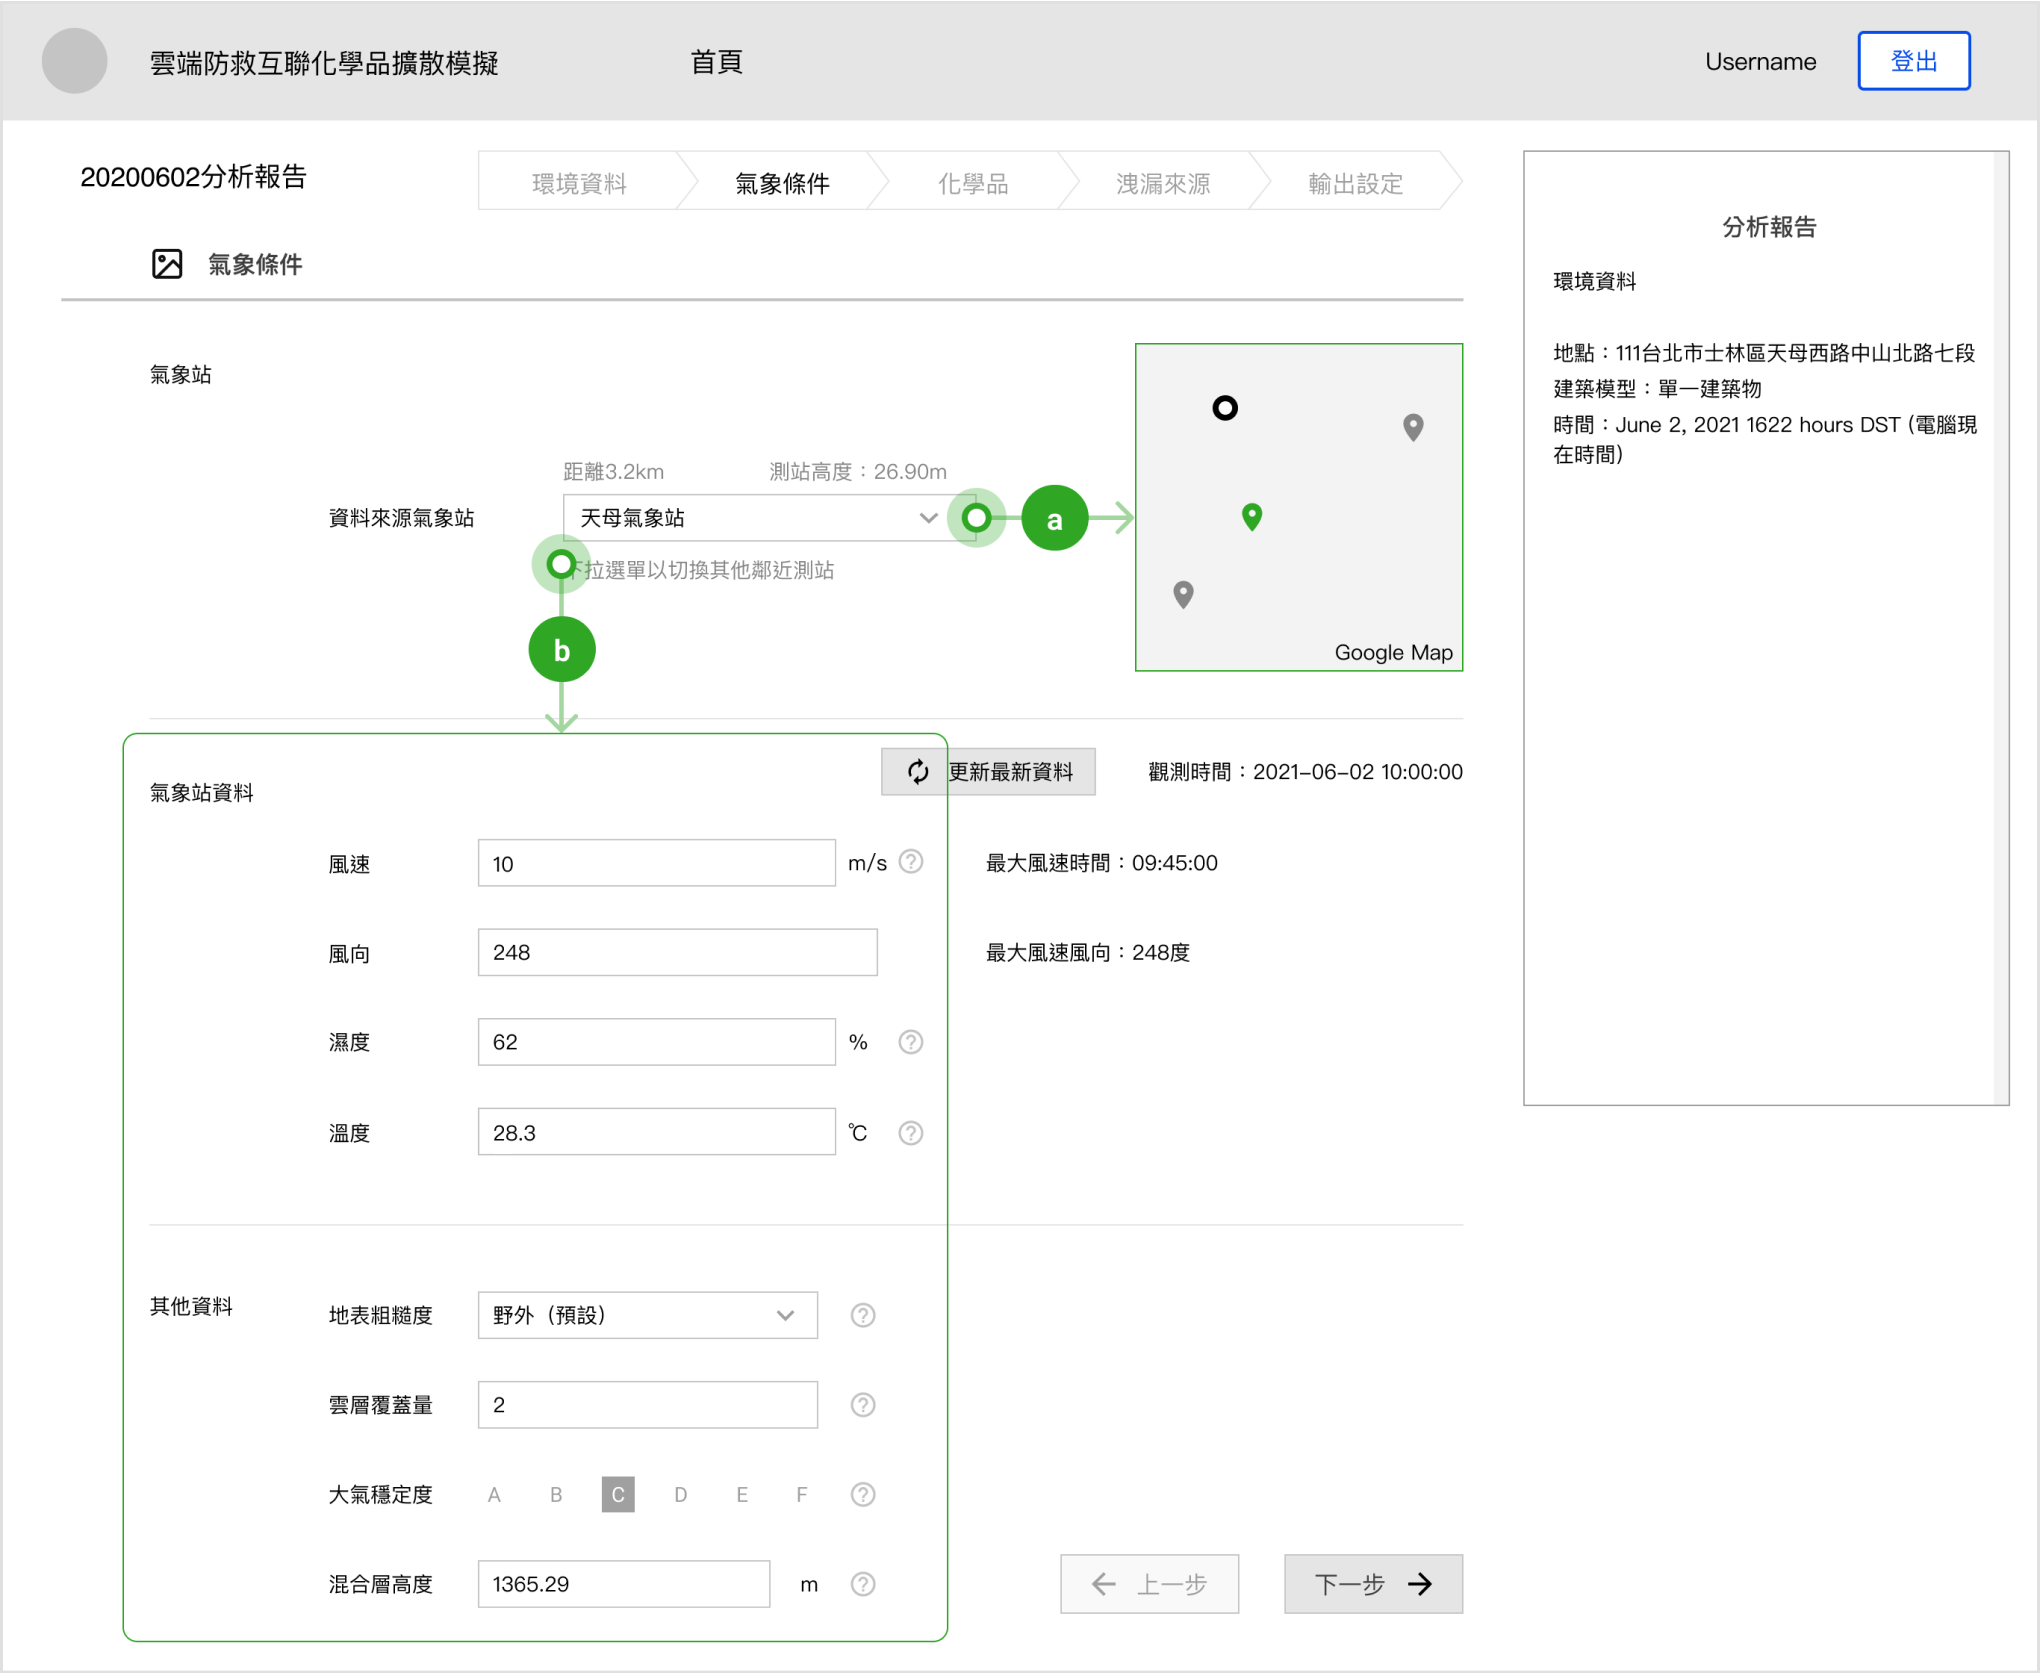
- Weather conditions automatic setup
The biggest change in this revision was that we discarded the complicated input columns in the original version. In another way, we connected the public APIs' of weather stations in Taiwan (a) and automatically filled in the requested columns. Some parameters, such as inversion height and stability class, etc, were calculated by the algorithm. (b)
In this way, the user doesn't need to fill in or calculate any data by themselves, which saves a lot of time.
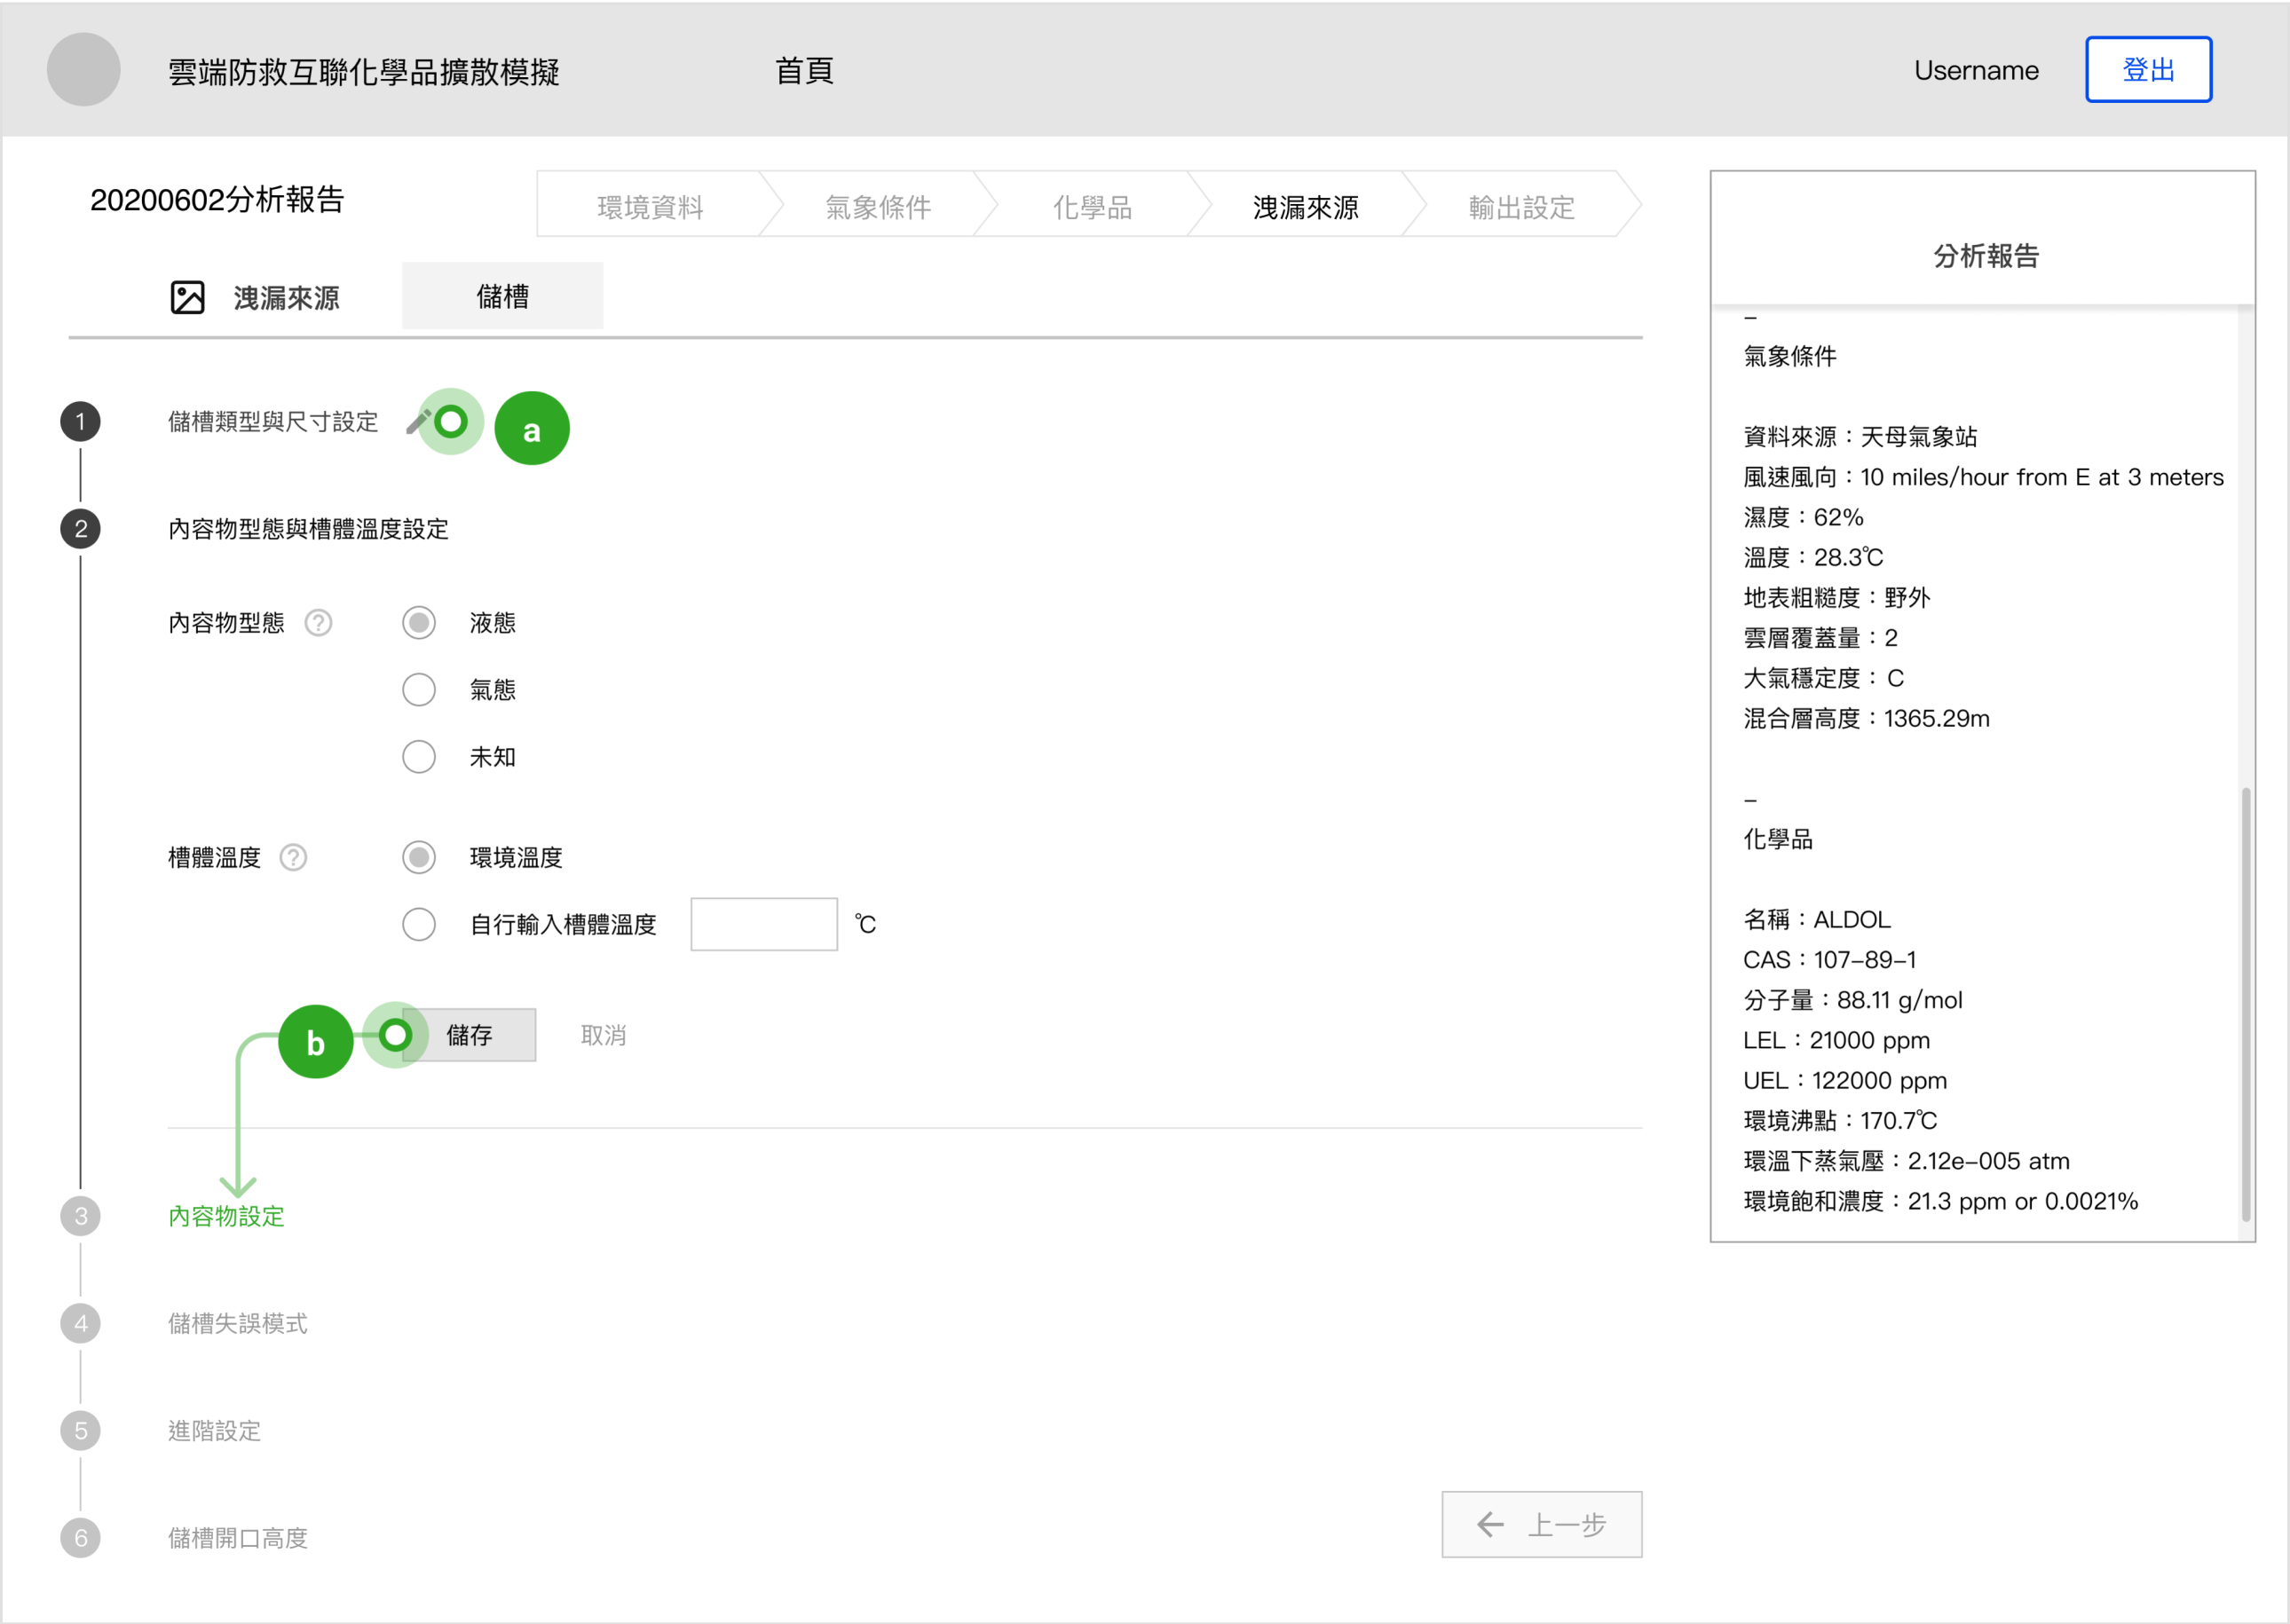
- Chemical in tank conditions setup
One of the setups in this software was to simulate the condition of chemicals stored in a tank. The setting process was very complicated, and each parameter would even interactively influence another one. Therefore, I used a process step pattern to minimize the user burden.
a. The user can edit the previous settings.
b. As some parameters would influence the next settings, I put a save button in each step and only when the button was activated and clicked will lead user to the next step.
Visual Design and User Flowchart
Design System
As for the design system, except for color and typography, I also designed some important components such as buttons, forms and modal, etc. Besides, I used Figma variants to improve my work efficiency.
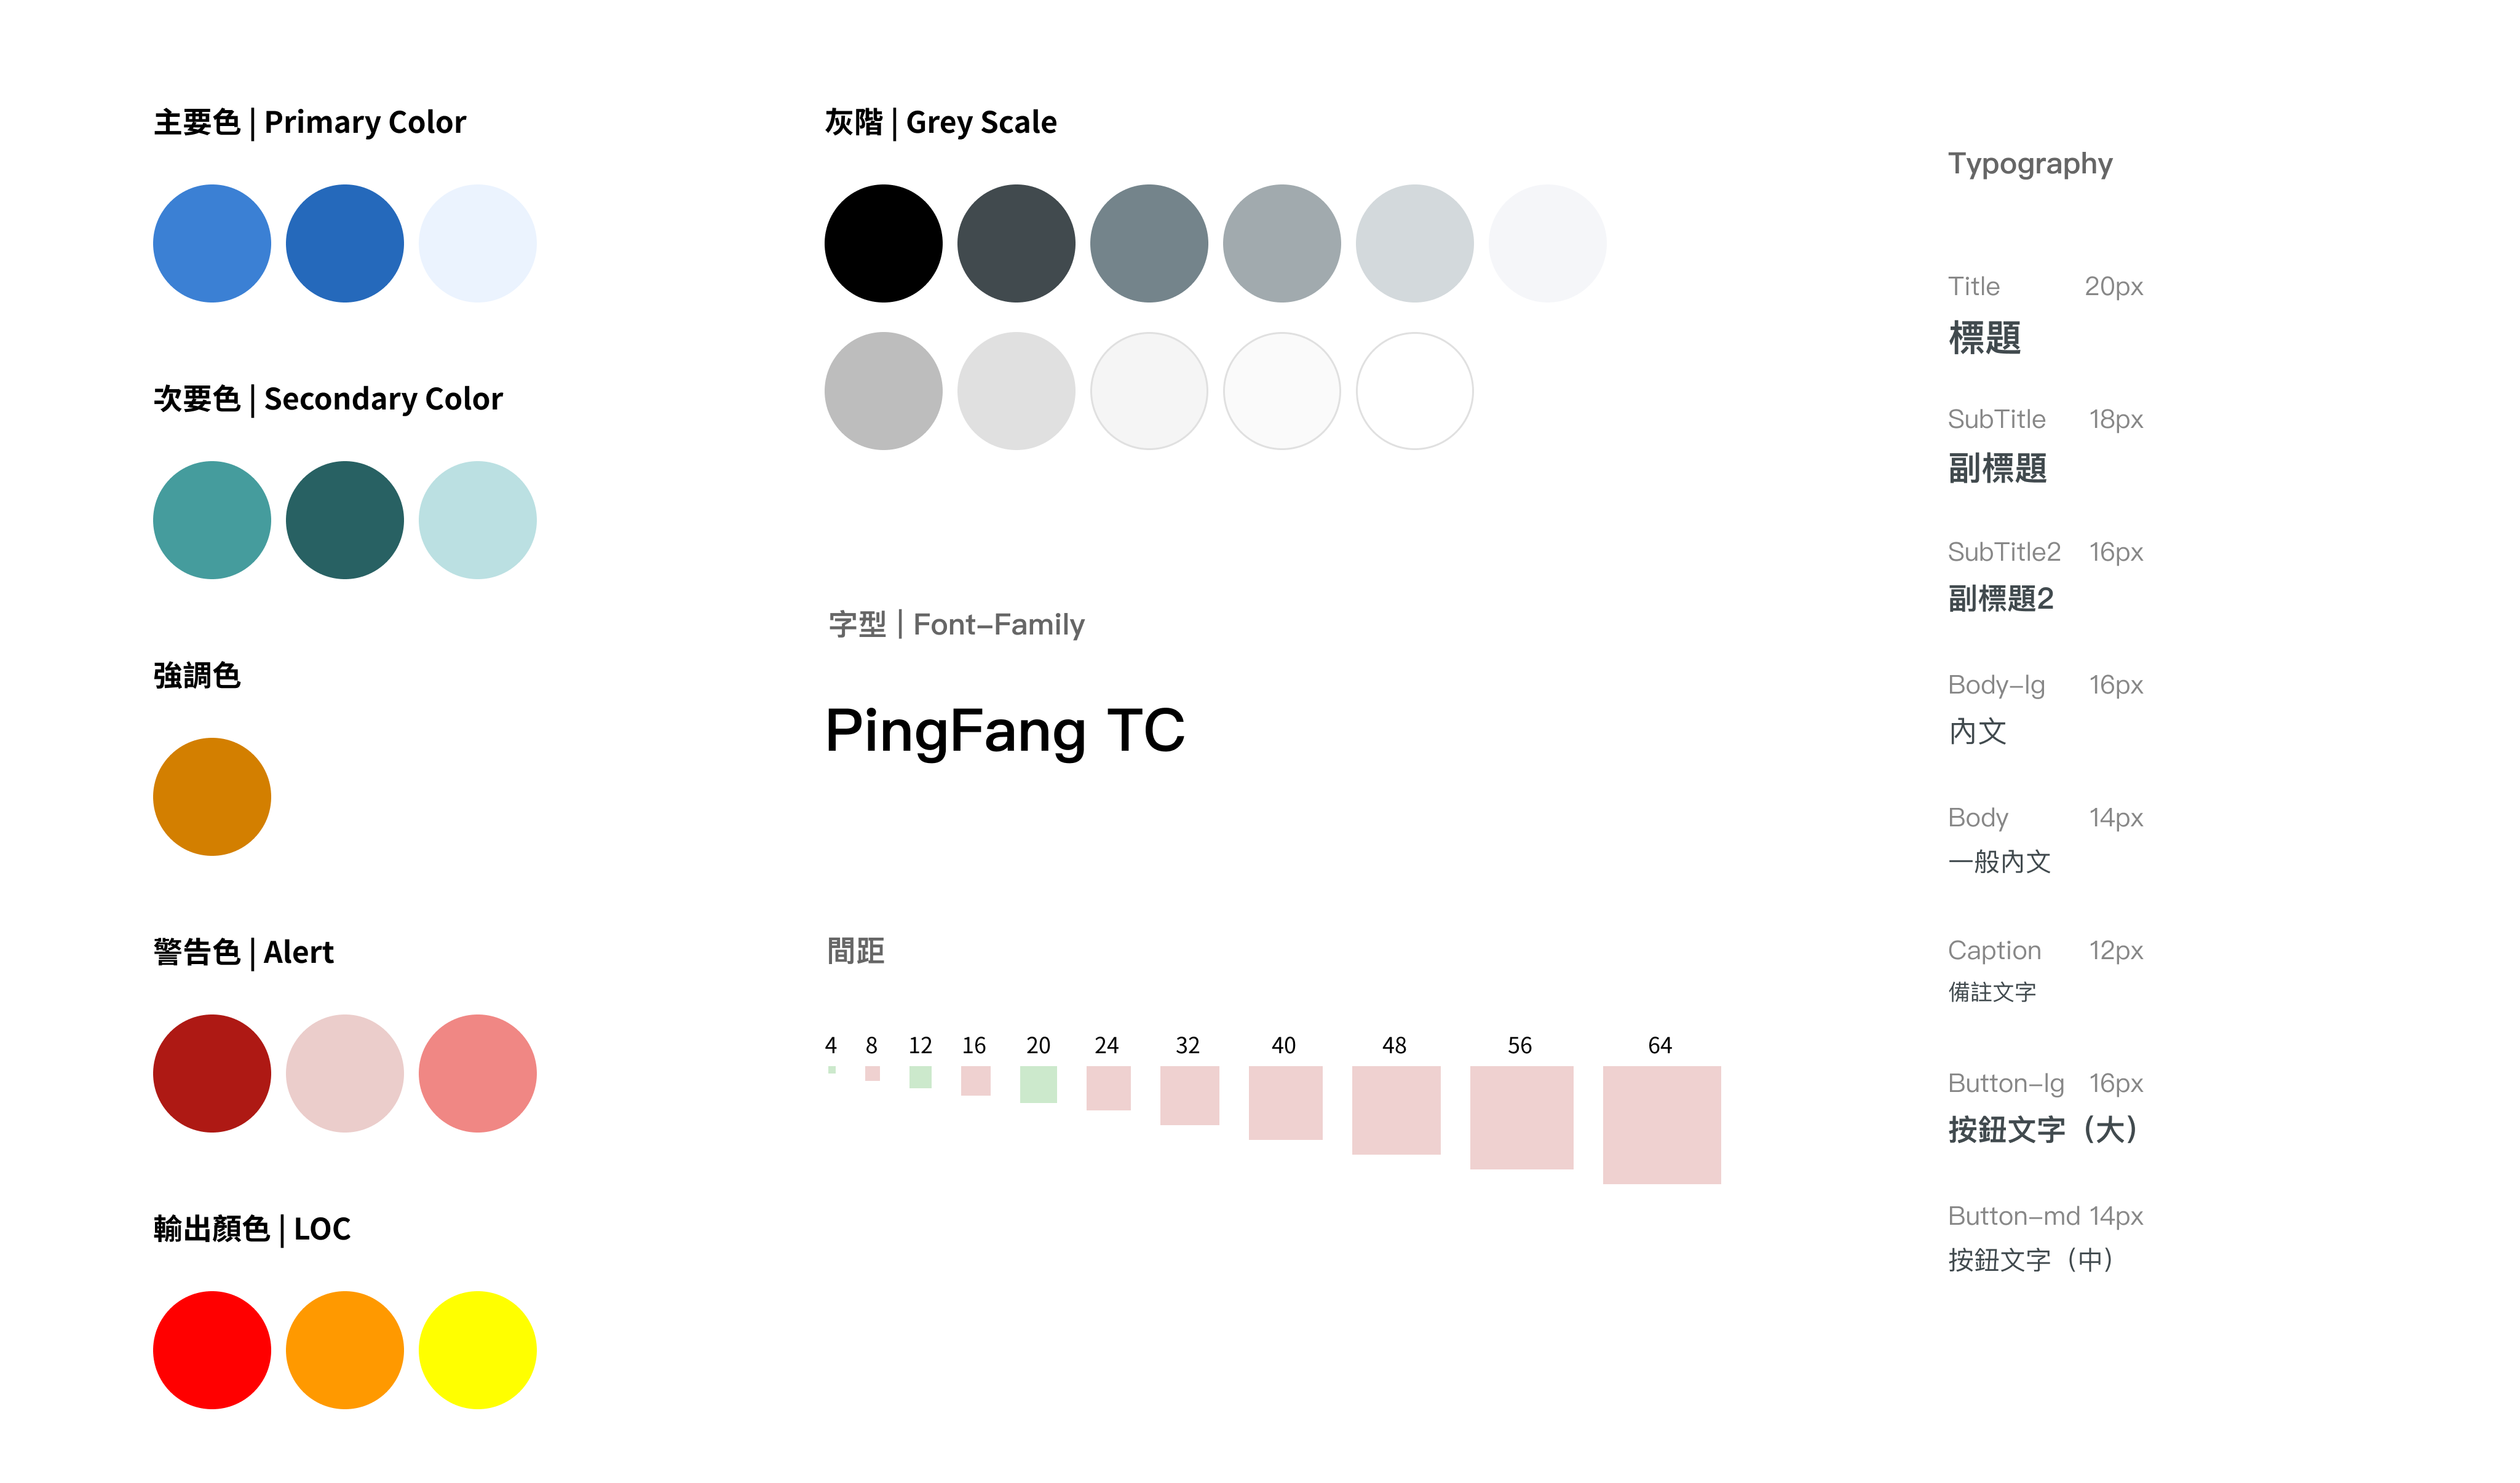
The primary and the secondary color were based on the web system that our client was using.
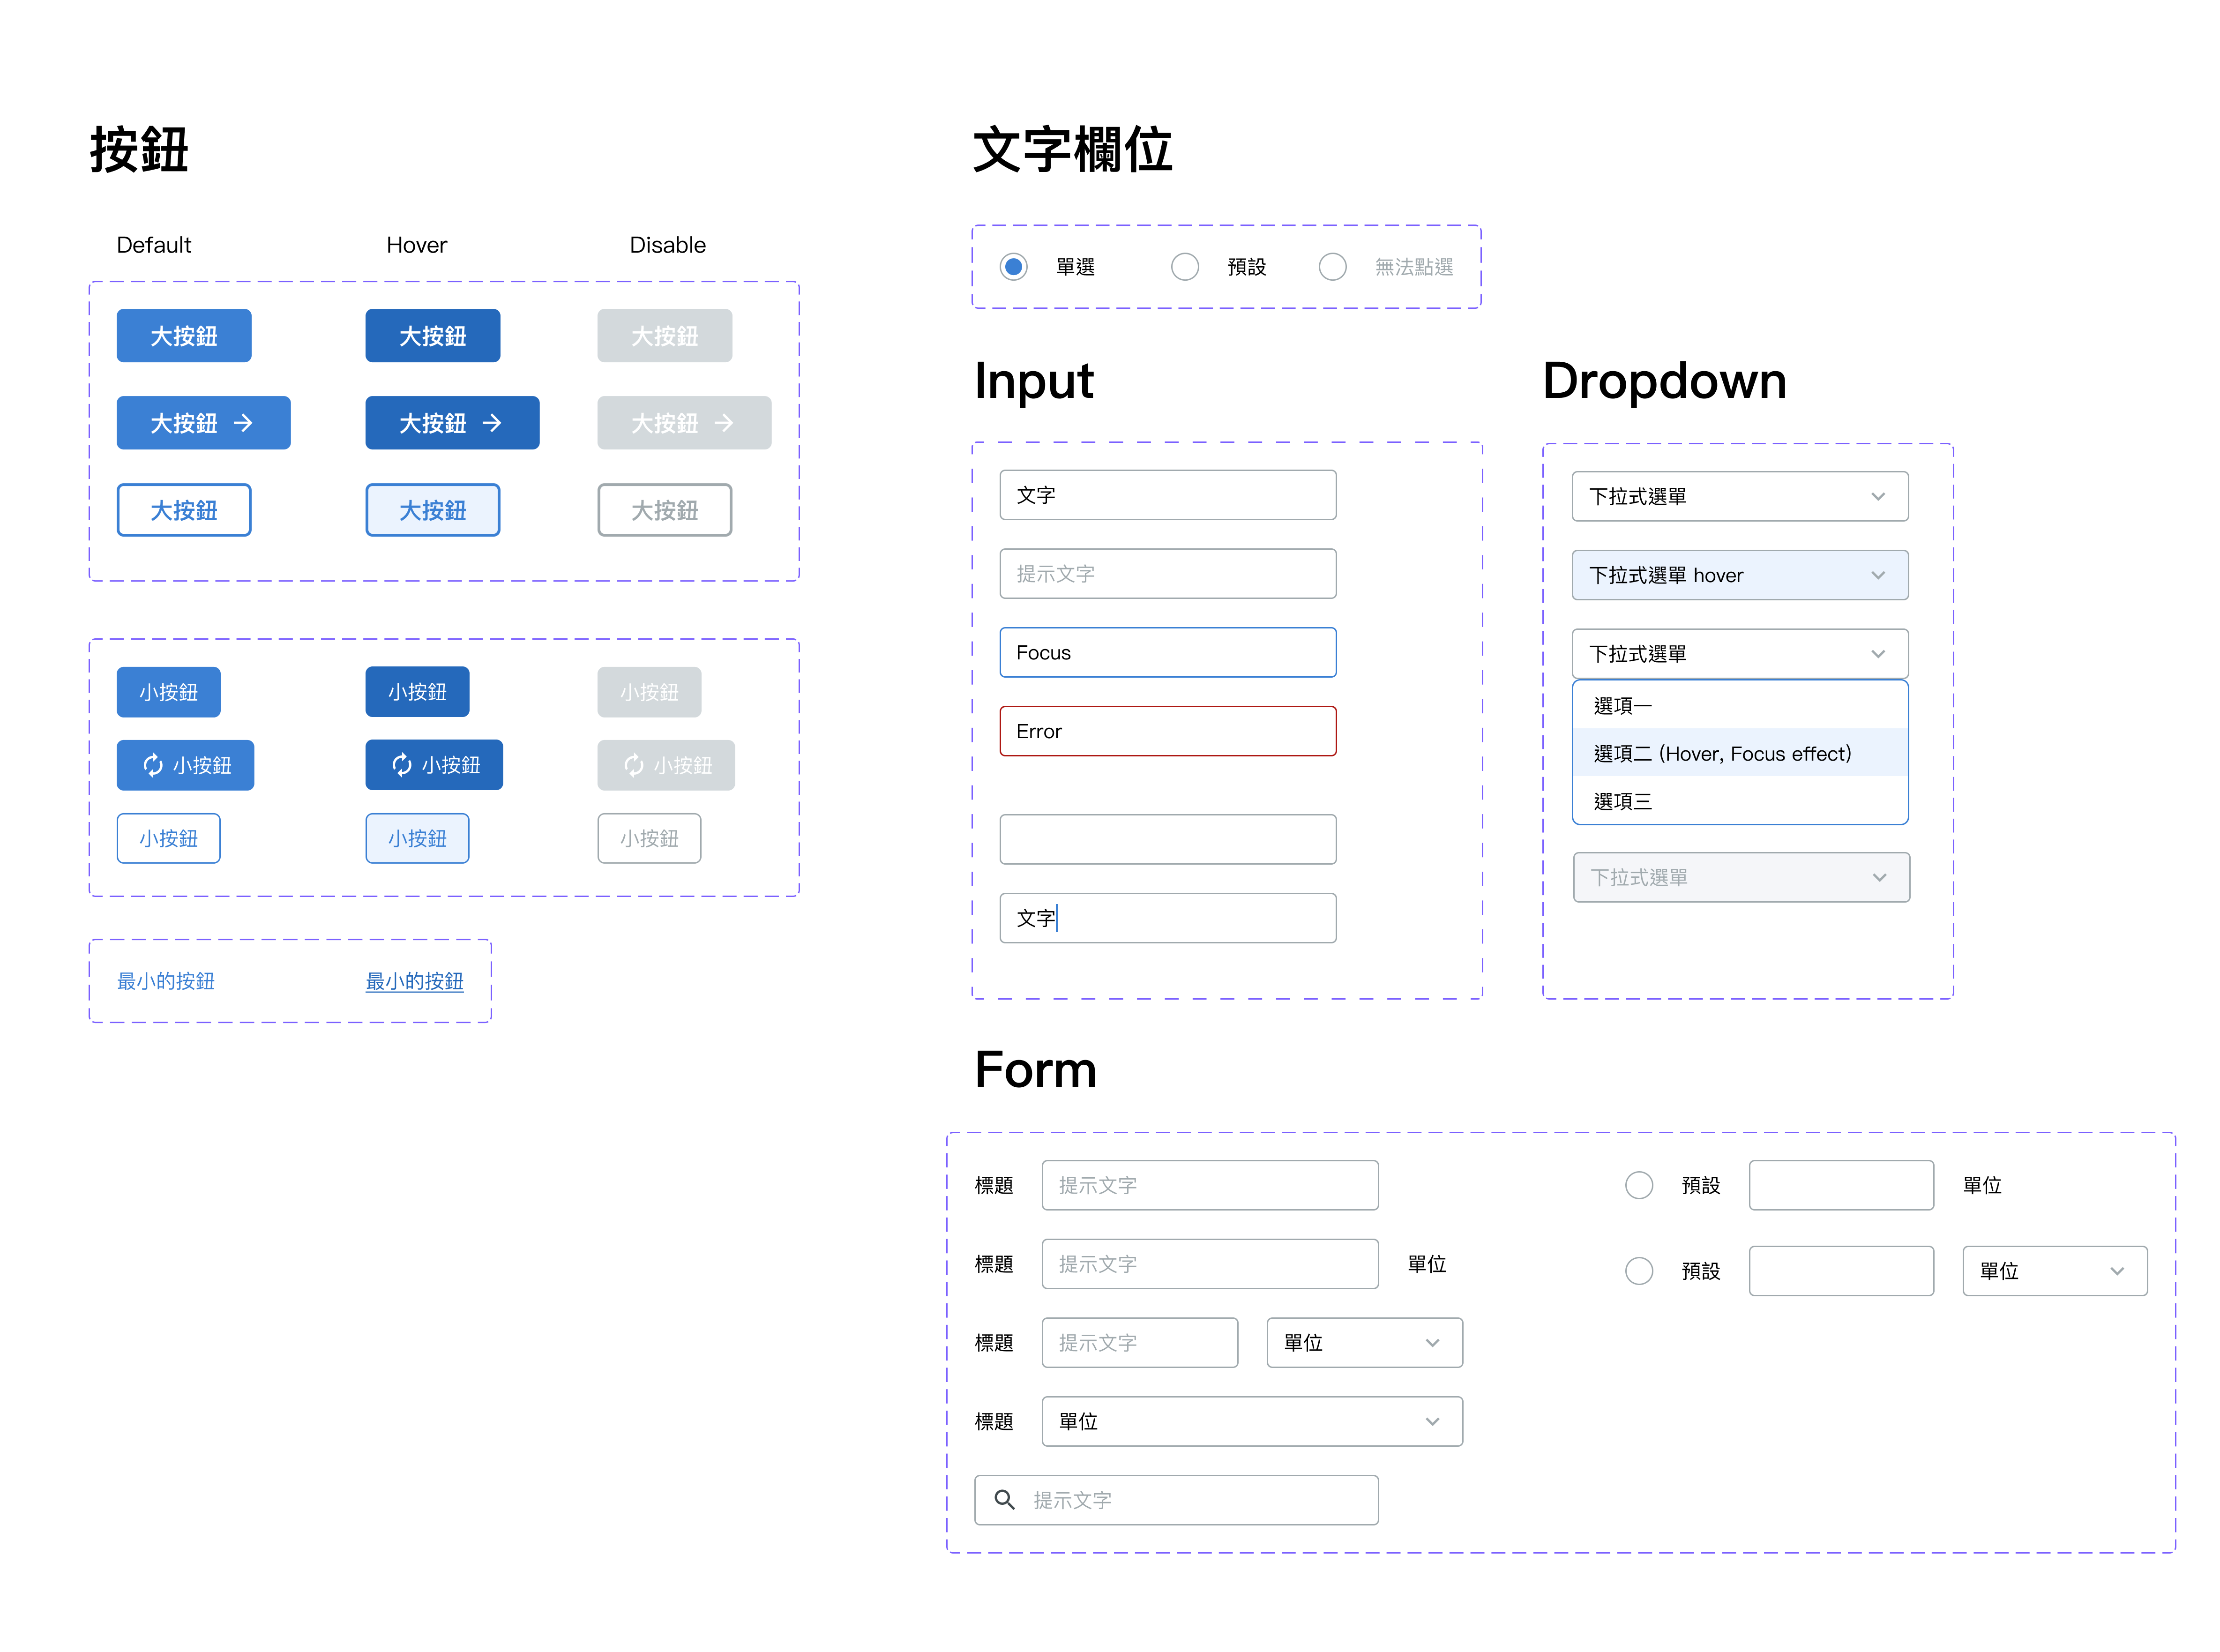
Some of the components I designed using Figma variants.
Environment Setup
The original wireframe design has been found imperfect during the development because the way developers called APIs were varied from my previous thoughts. Therefore, I adjusted the user flow of location input columns.
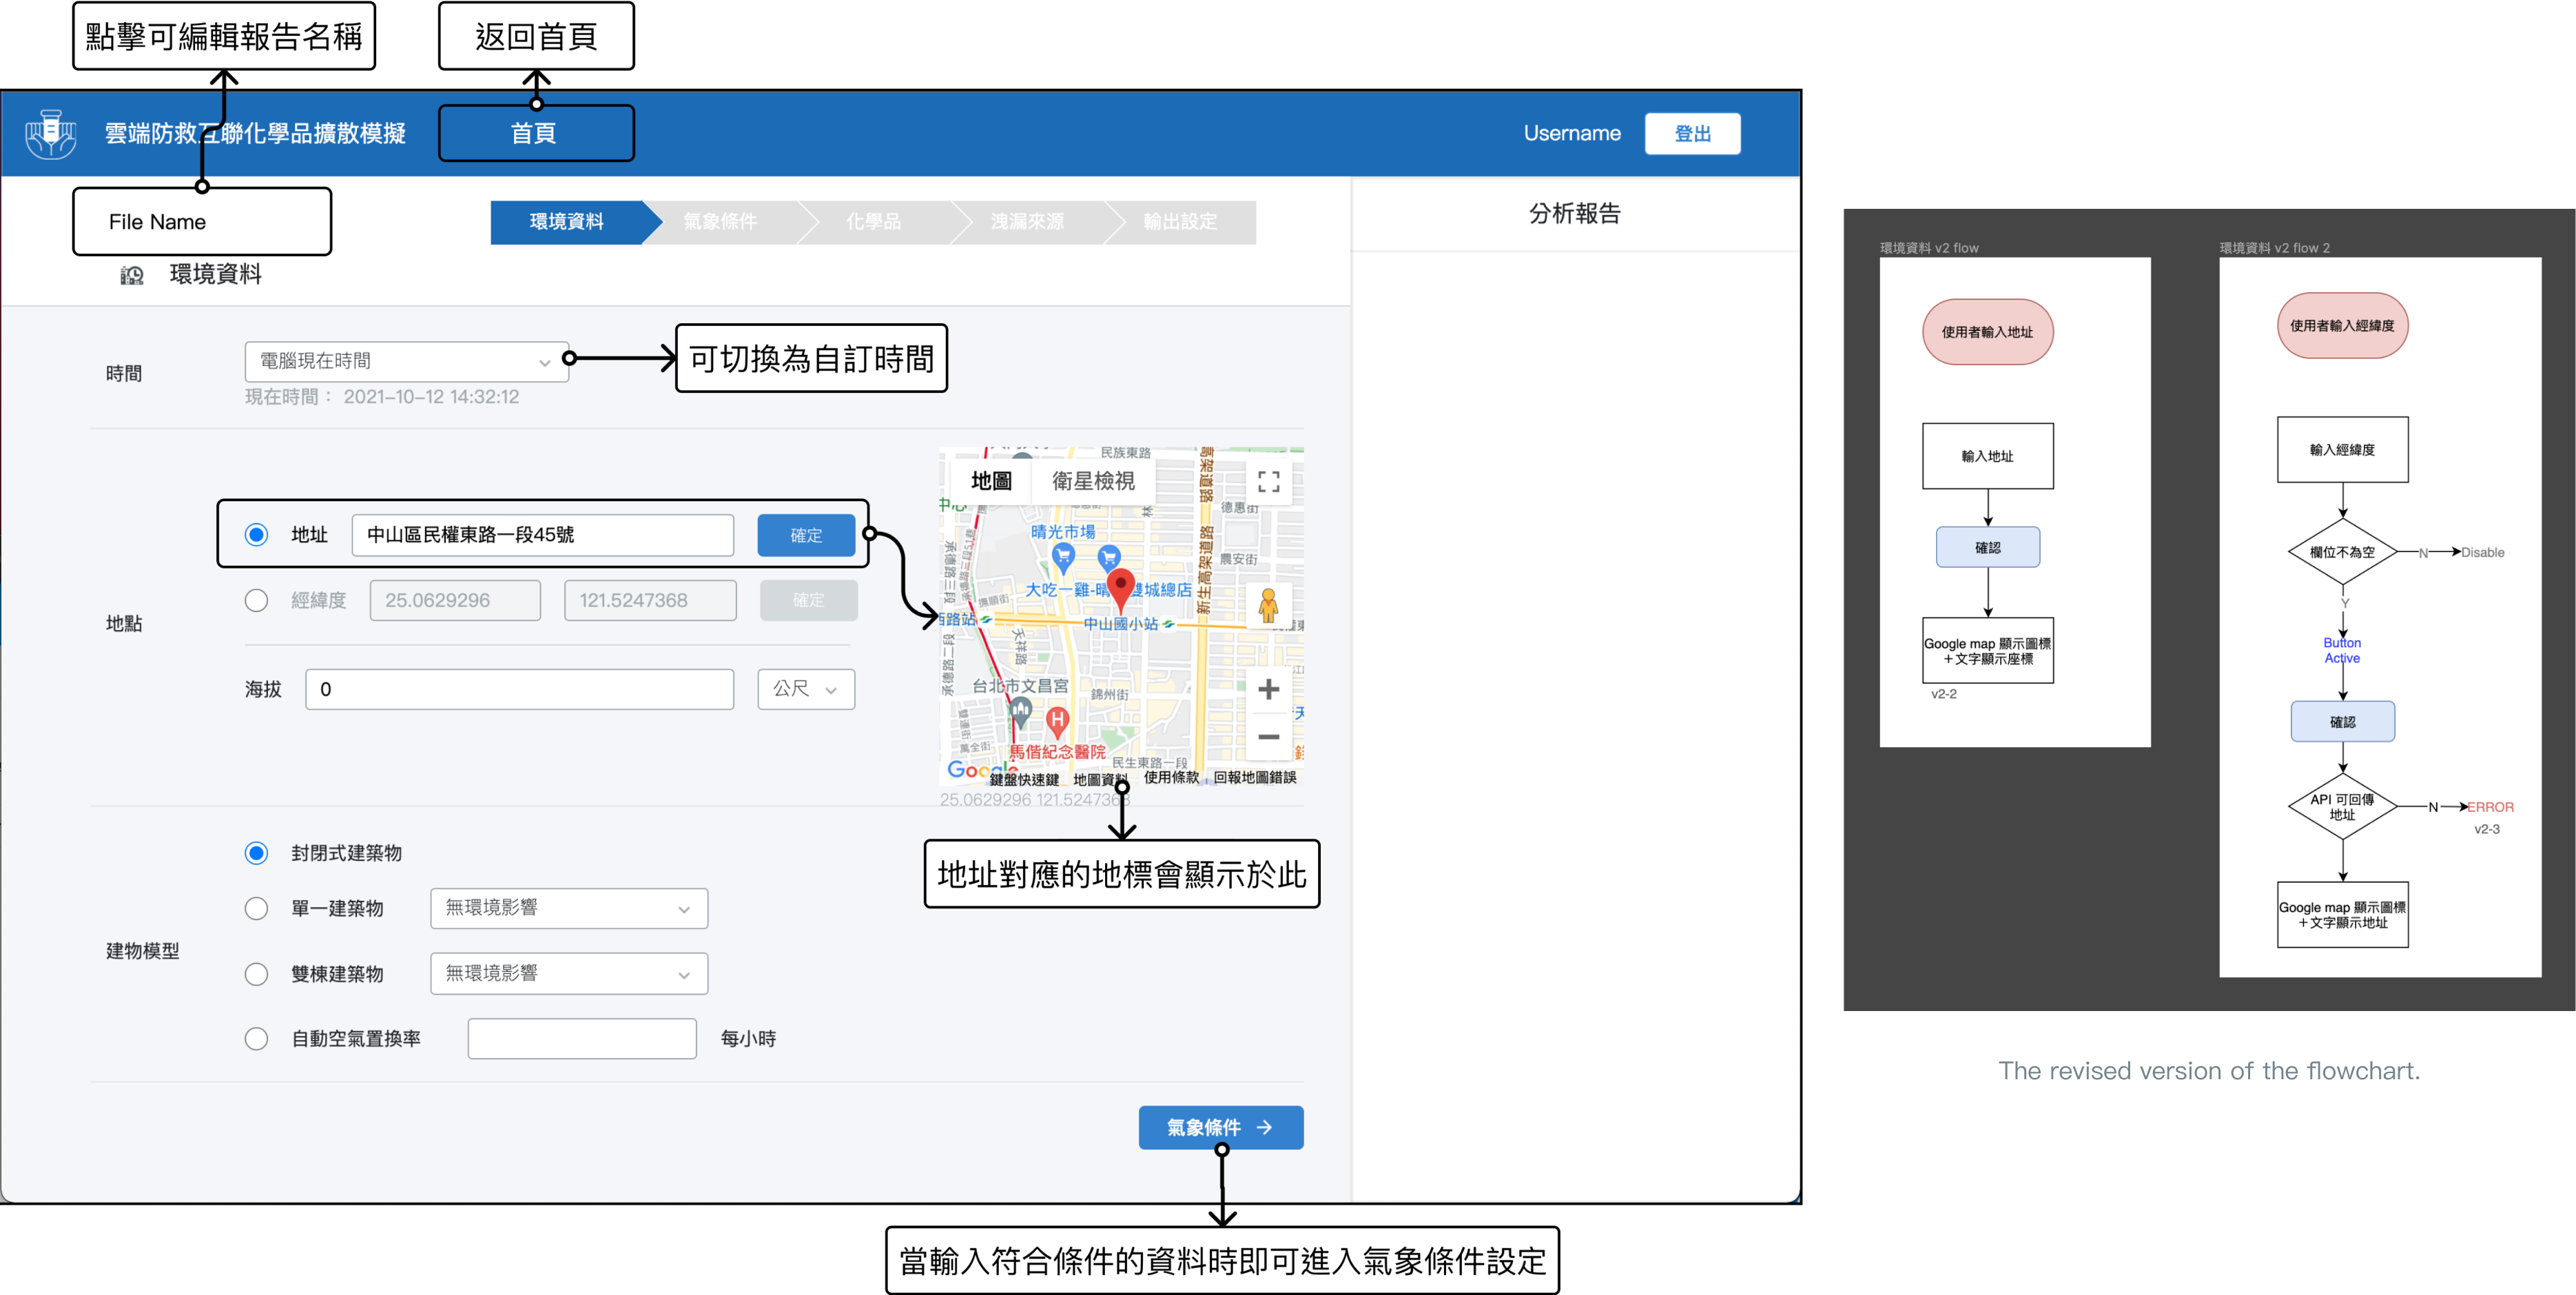
How I Presented my Design to Developers
If the flowchart was not complicated, I would use some simple flow arrows to demonstrate the interactions and describe the conditions, regulations, and default options on notes to make communication with developers more efficient.
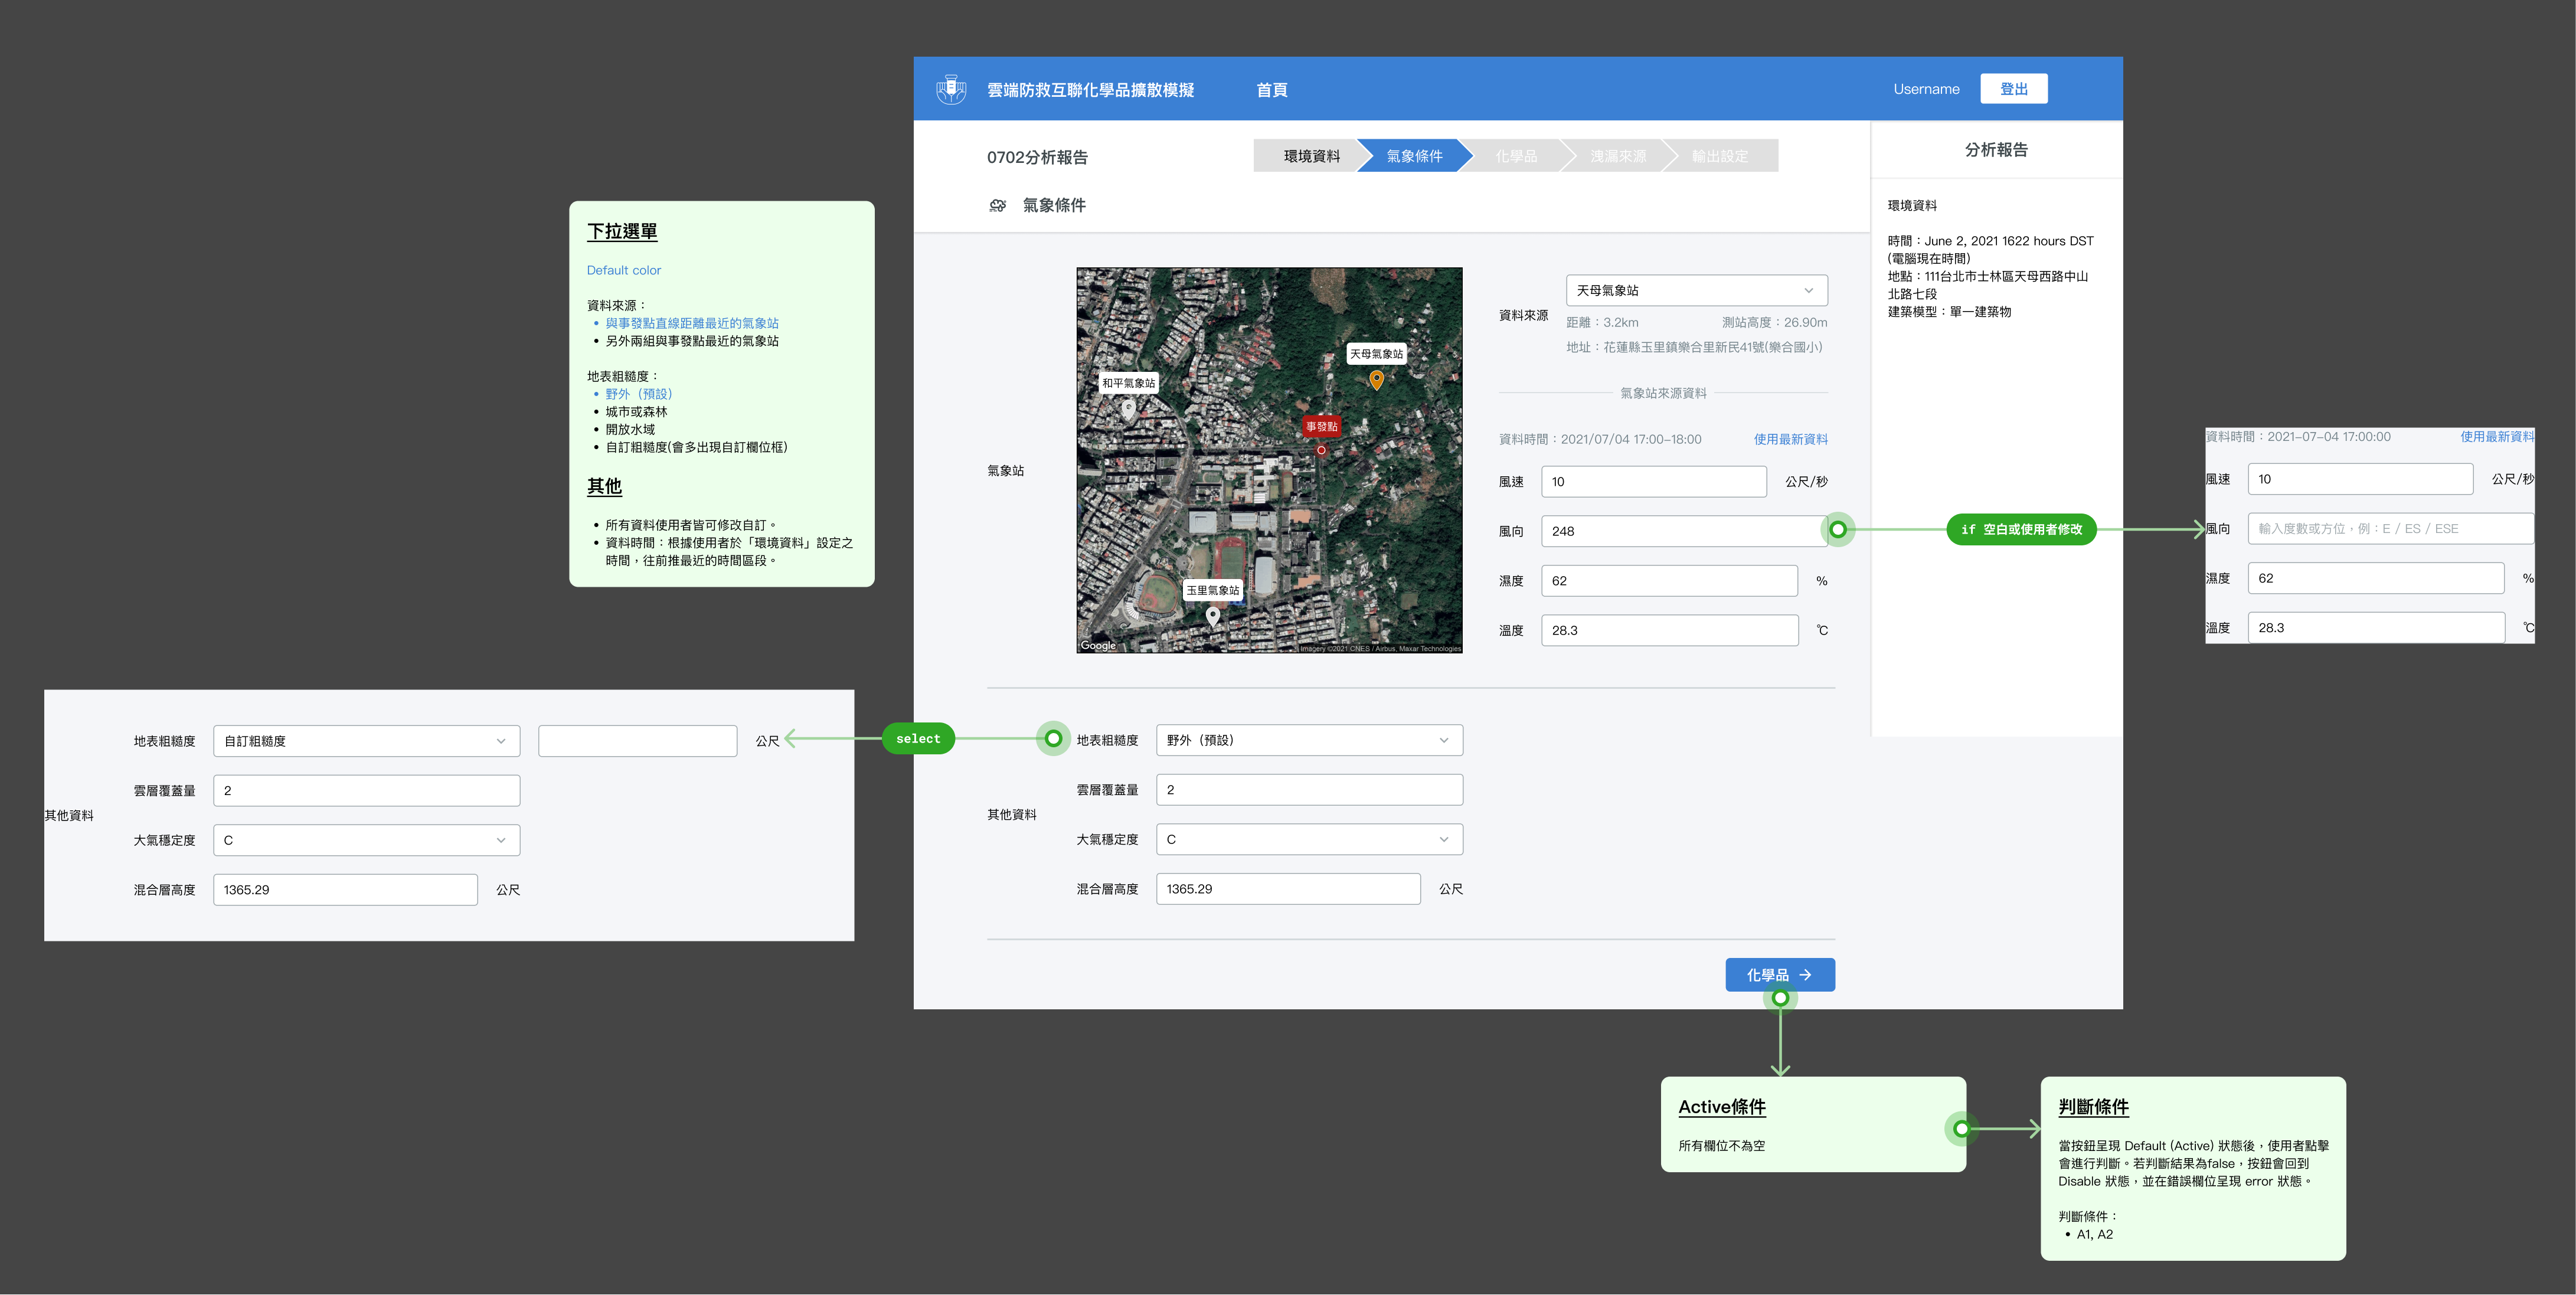
The weather conditions automatic setup page.
However, the user flows were usually complicated, so I would normally illustrate an independent flowchart to explain the interactions.
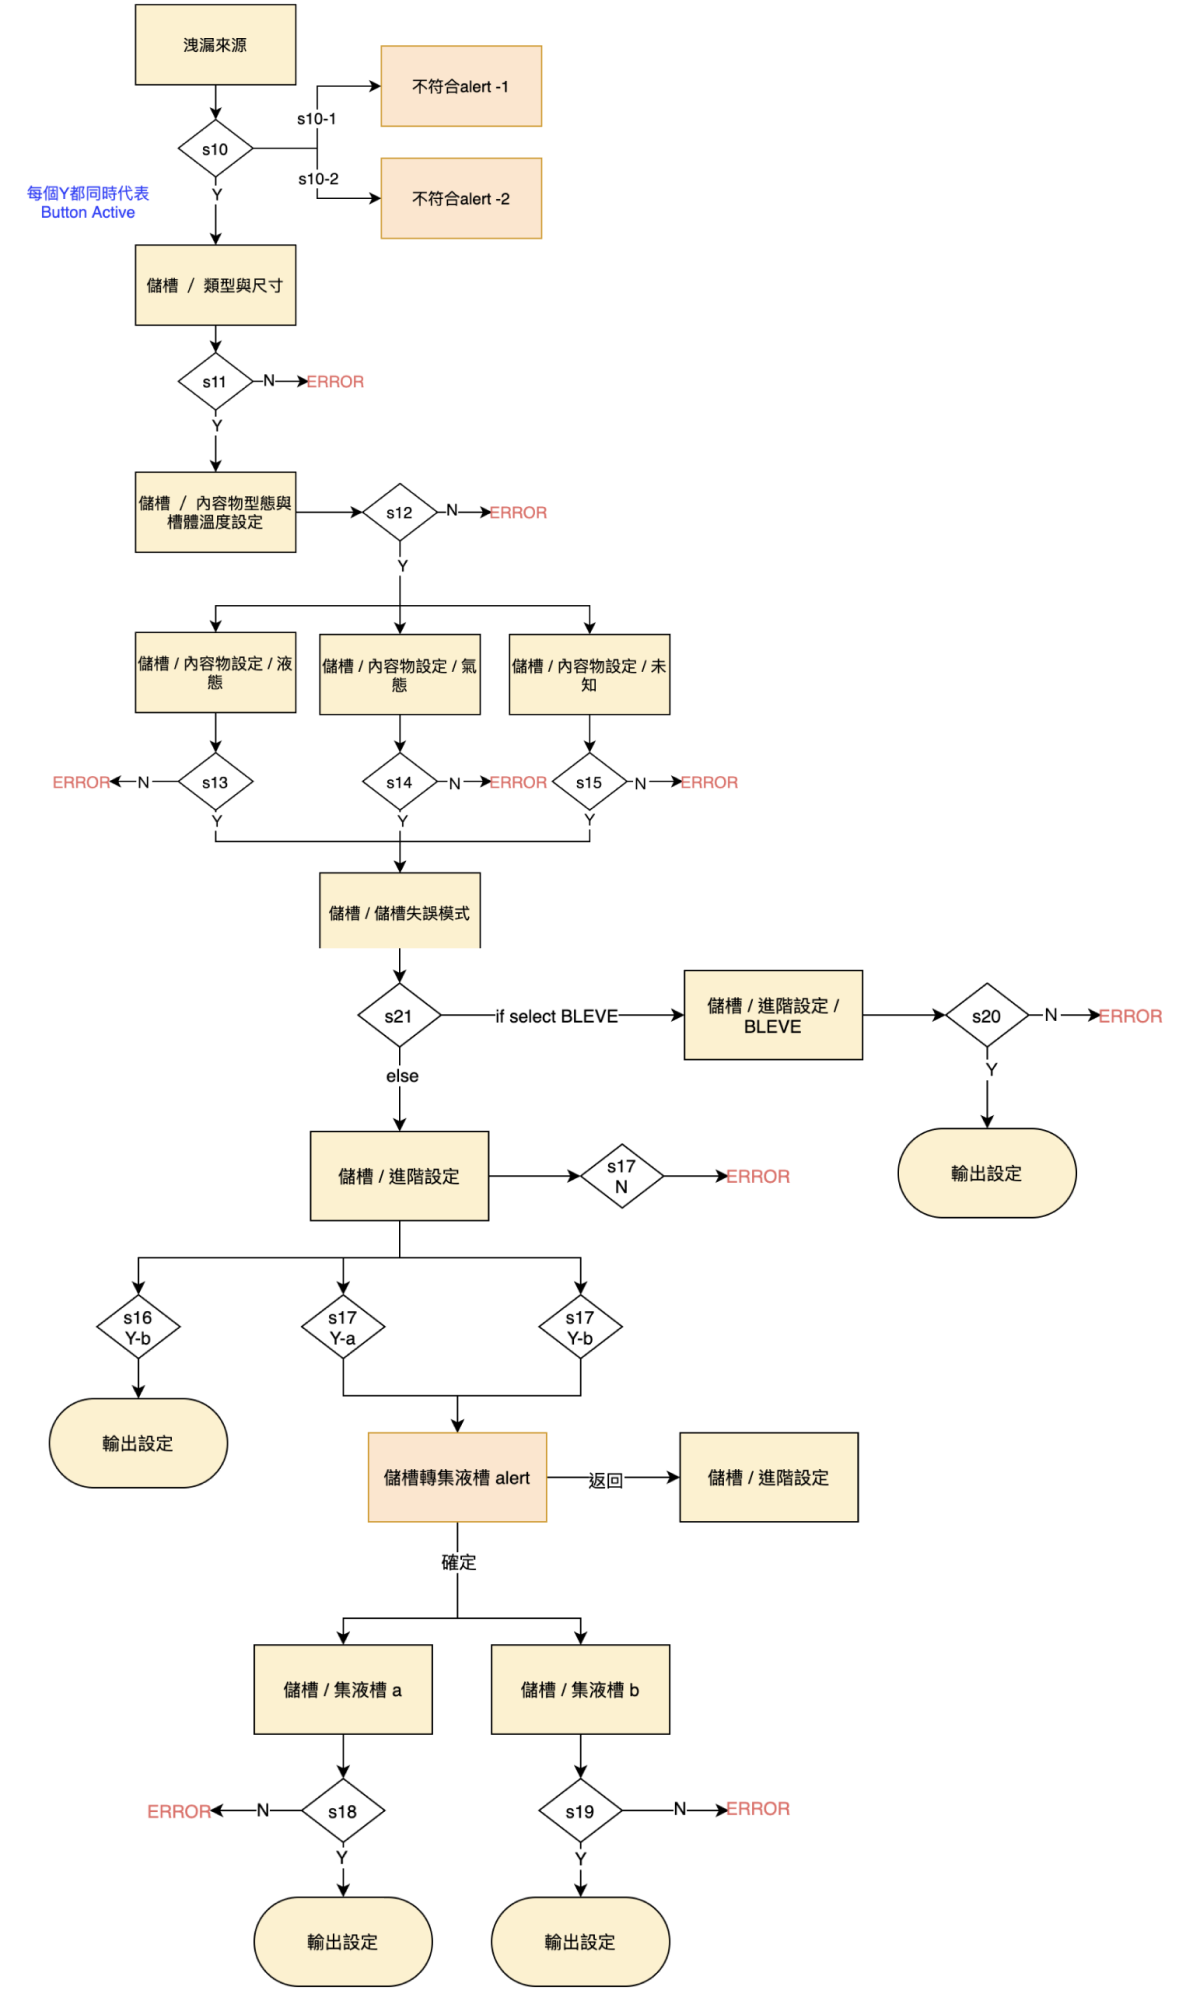
The complicated flow of chemical in tank conditions setup.
Some Other Pages Worth Sharing
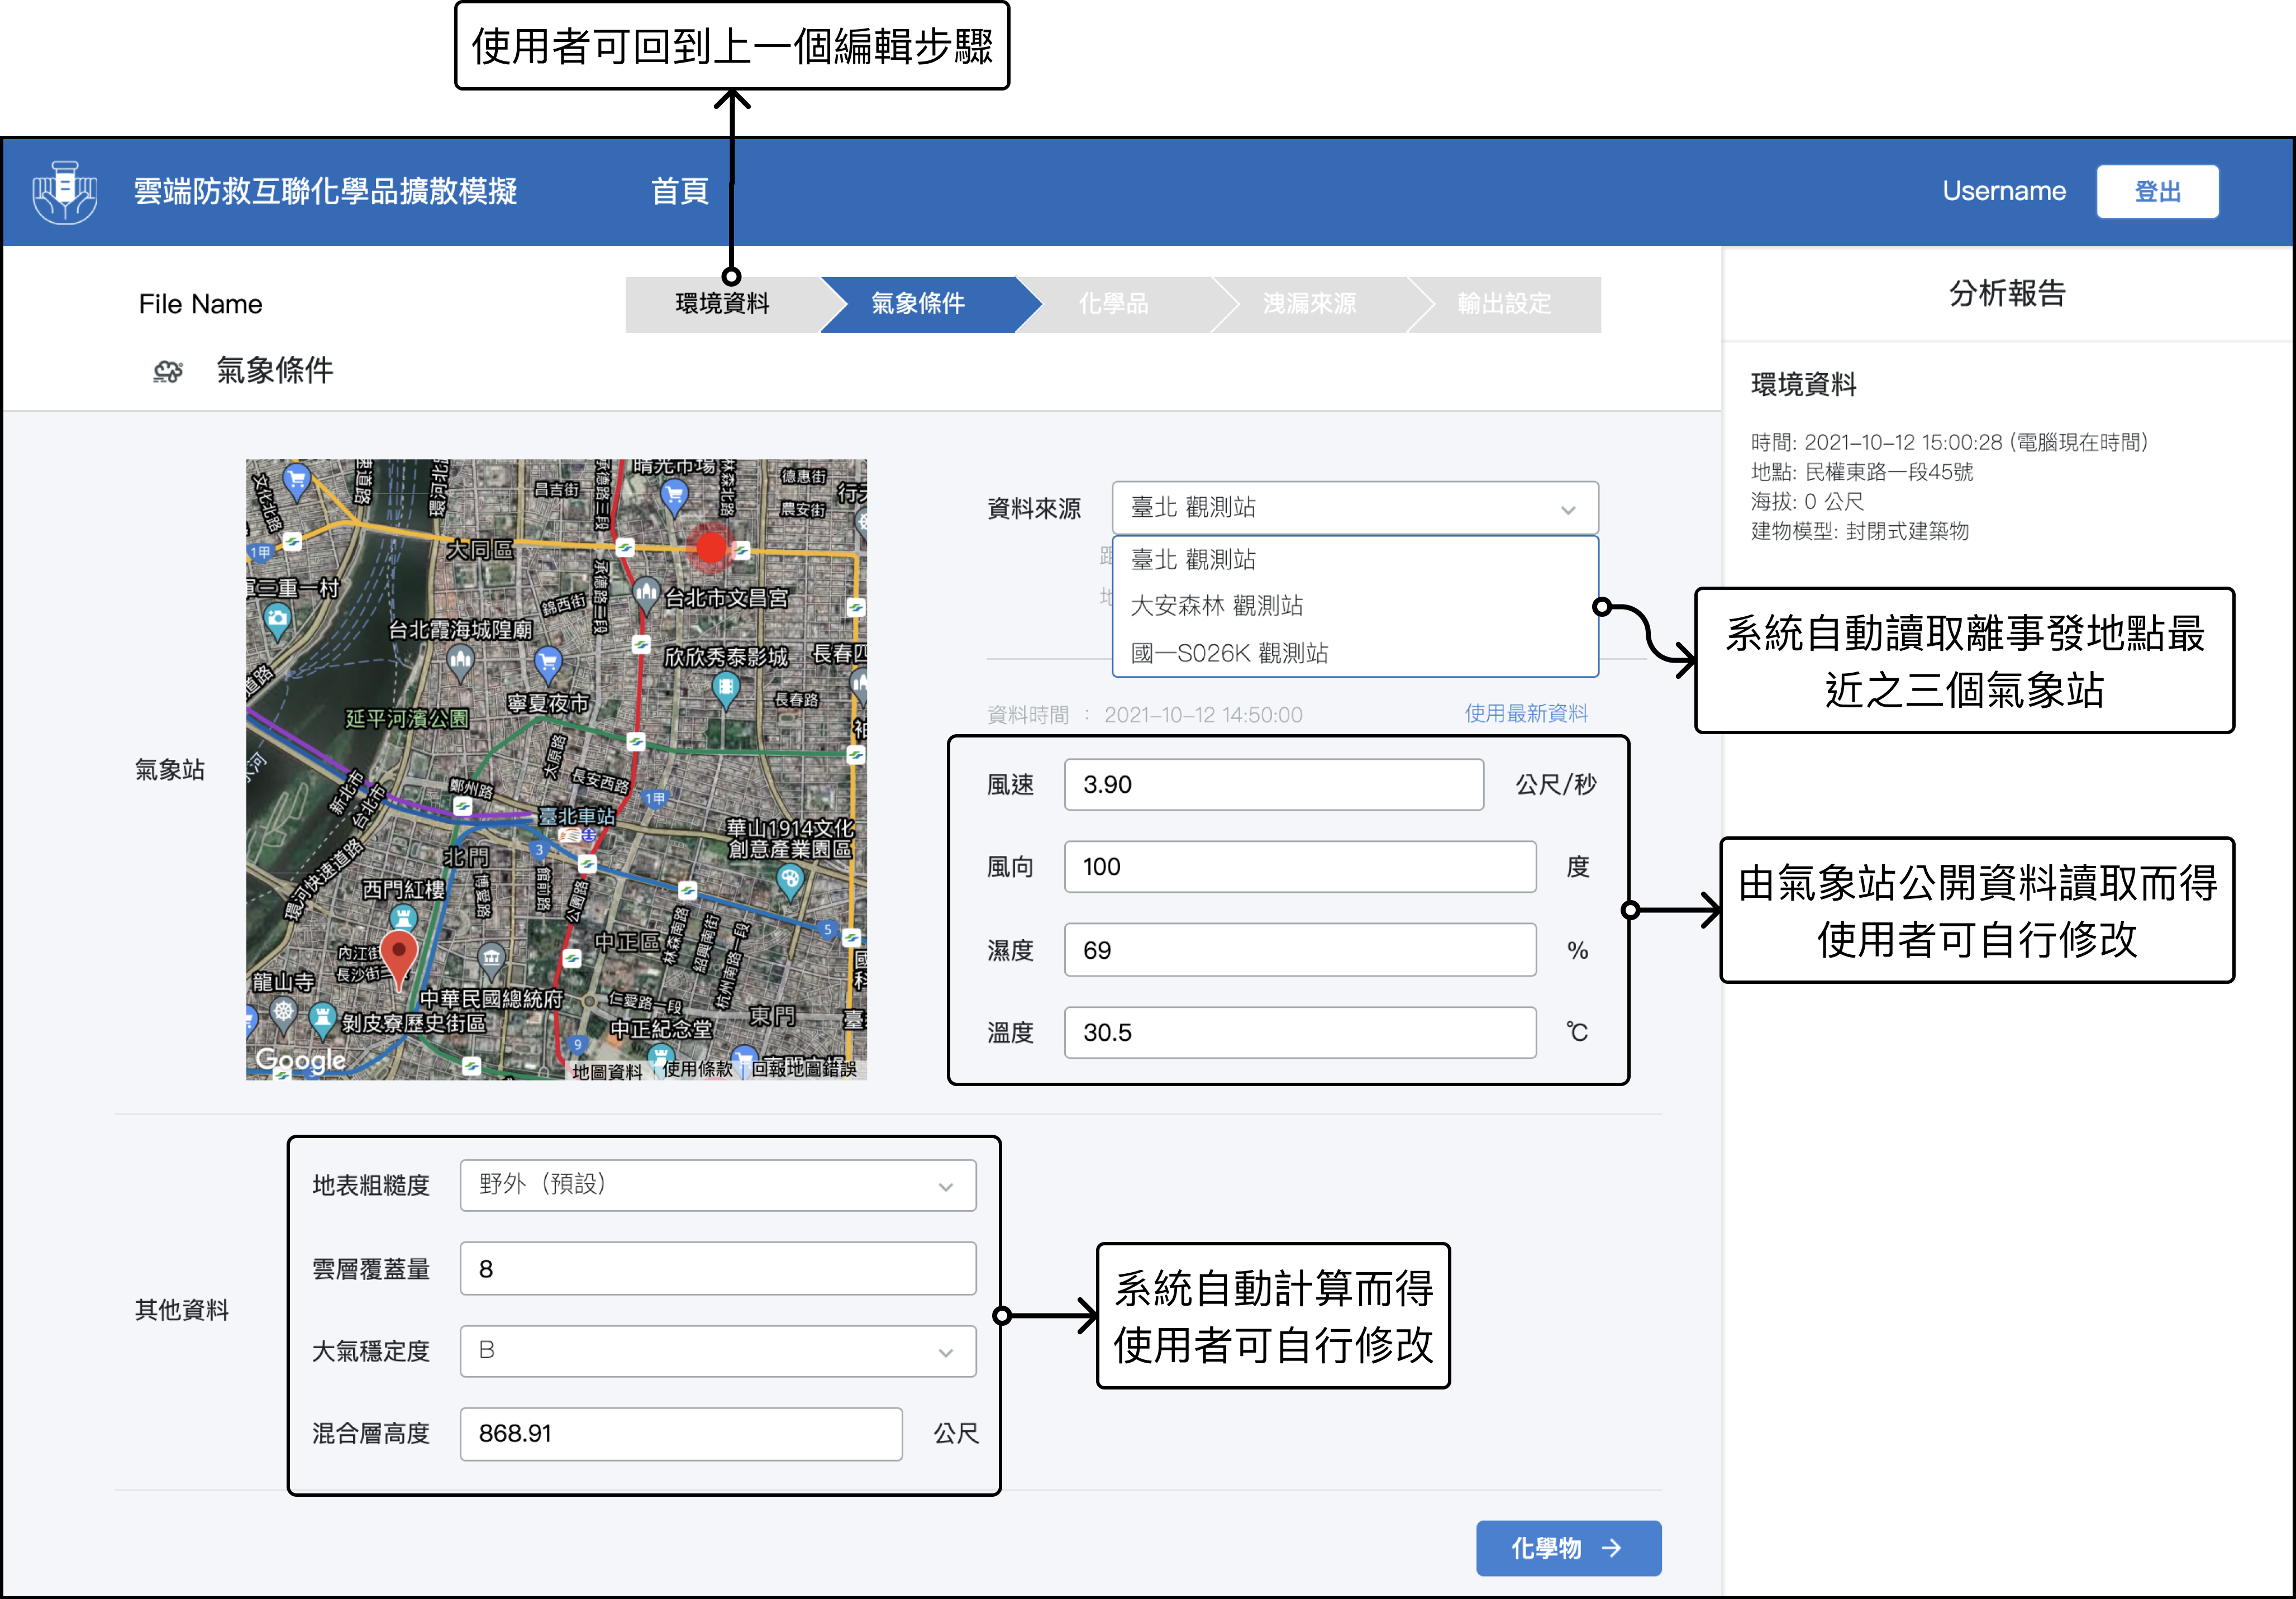
The environment conditions automatic setup page.
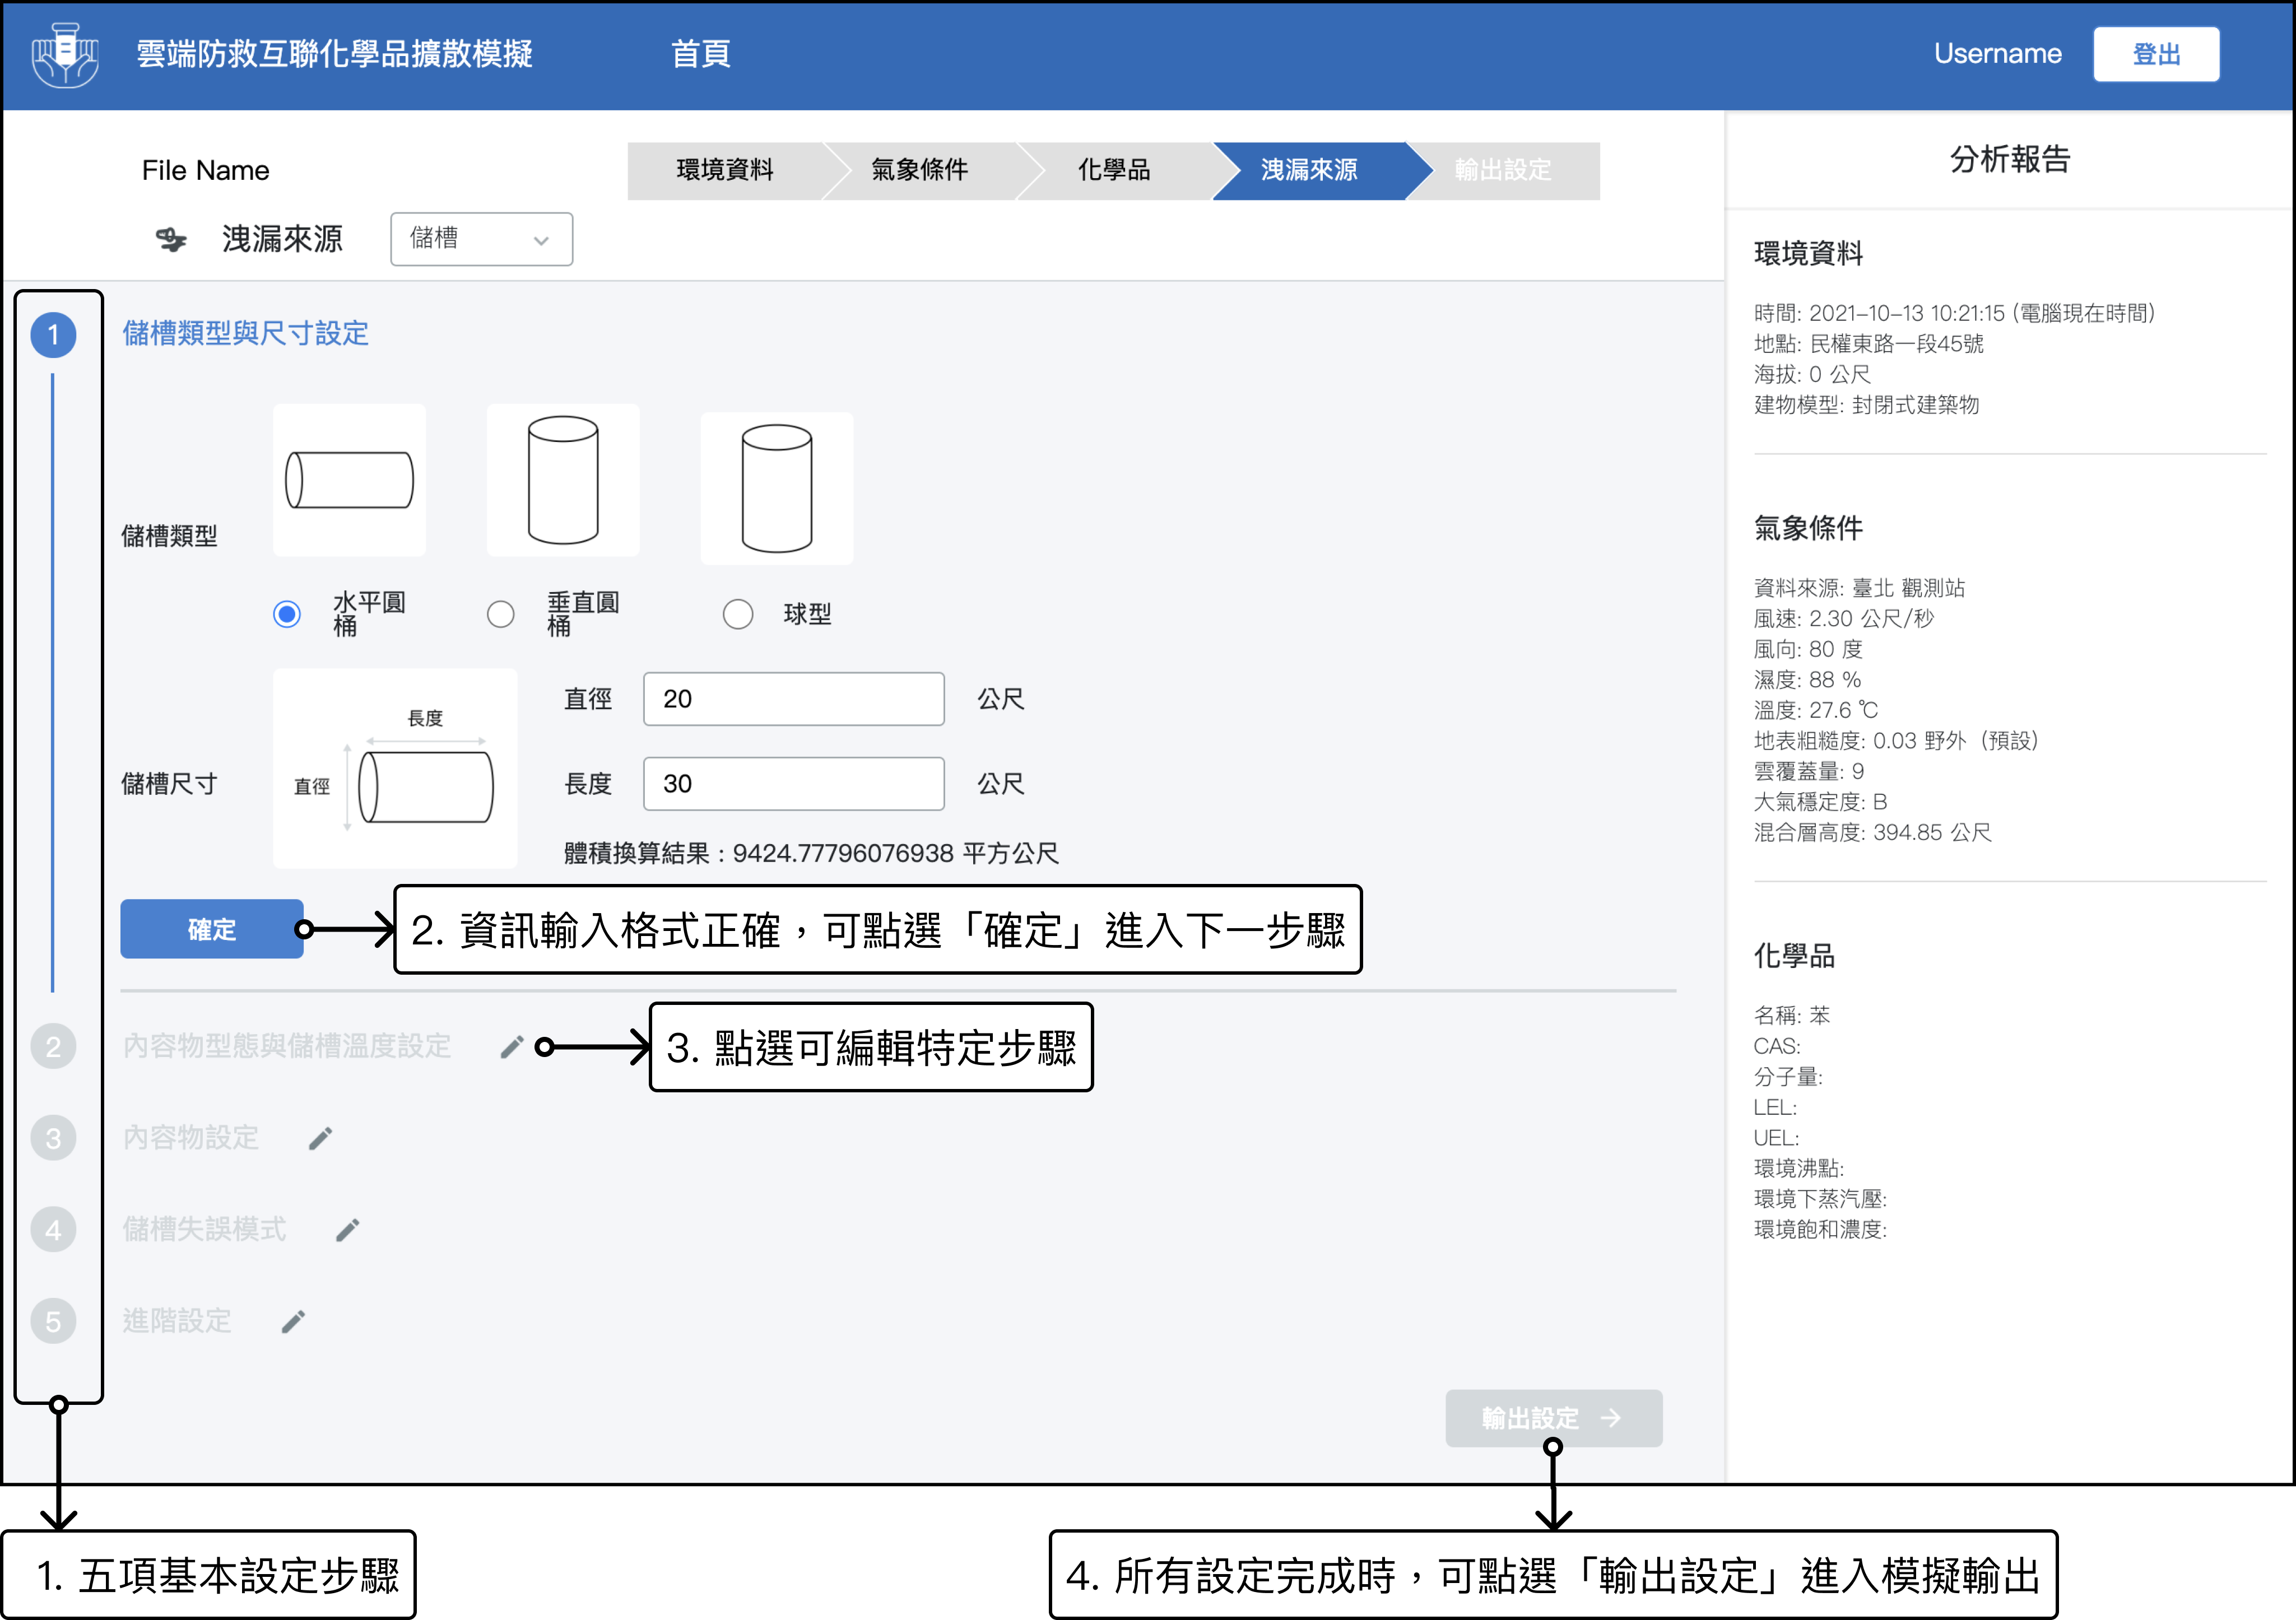
The chemical in tank setting page.
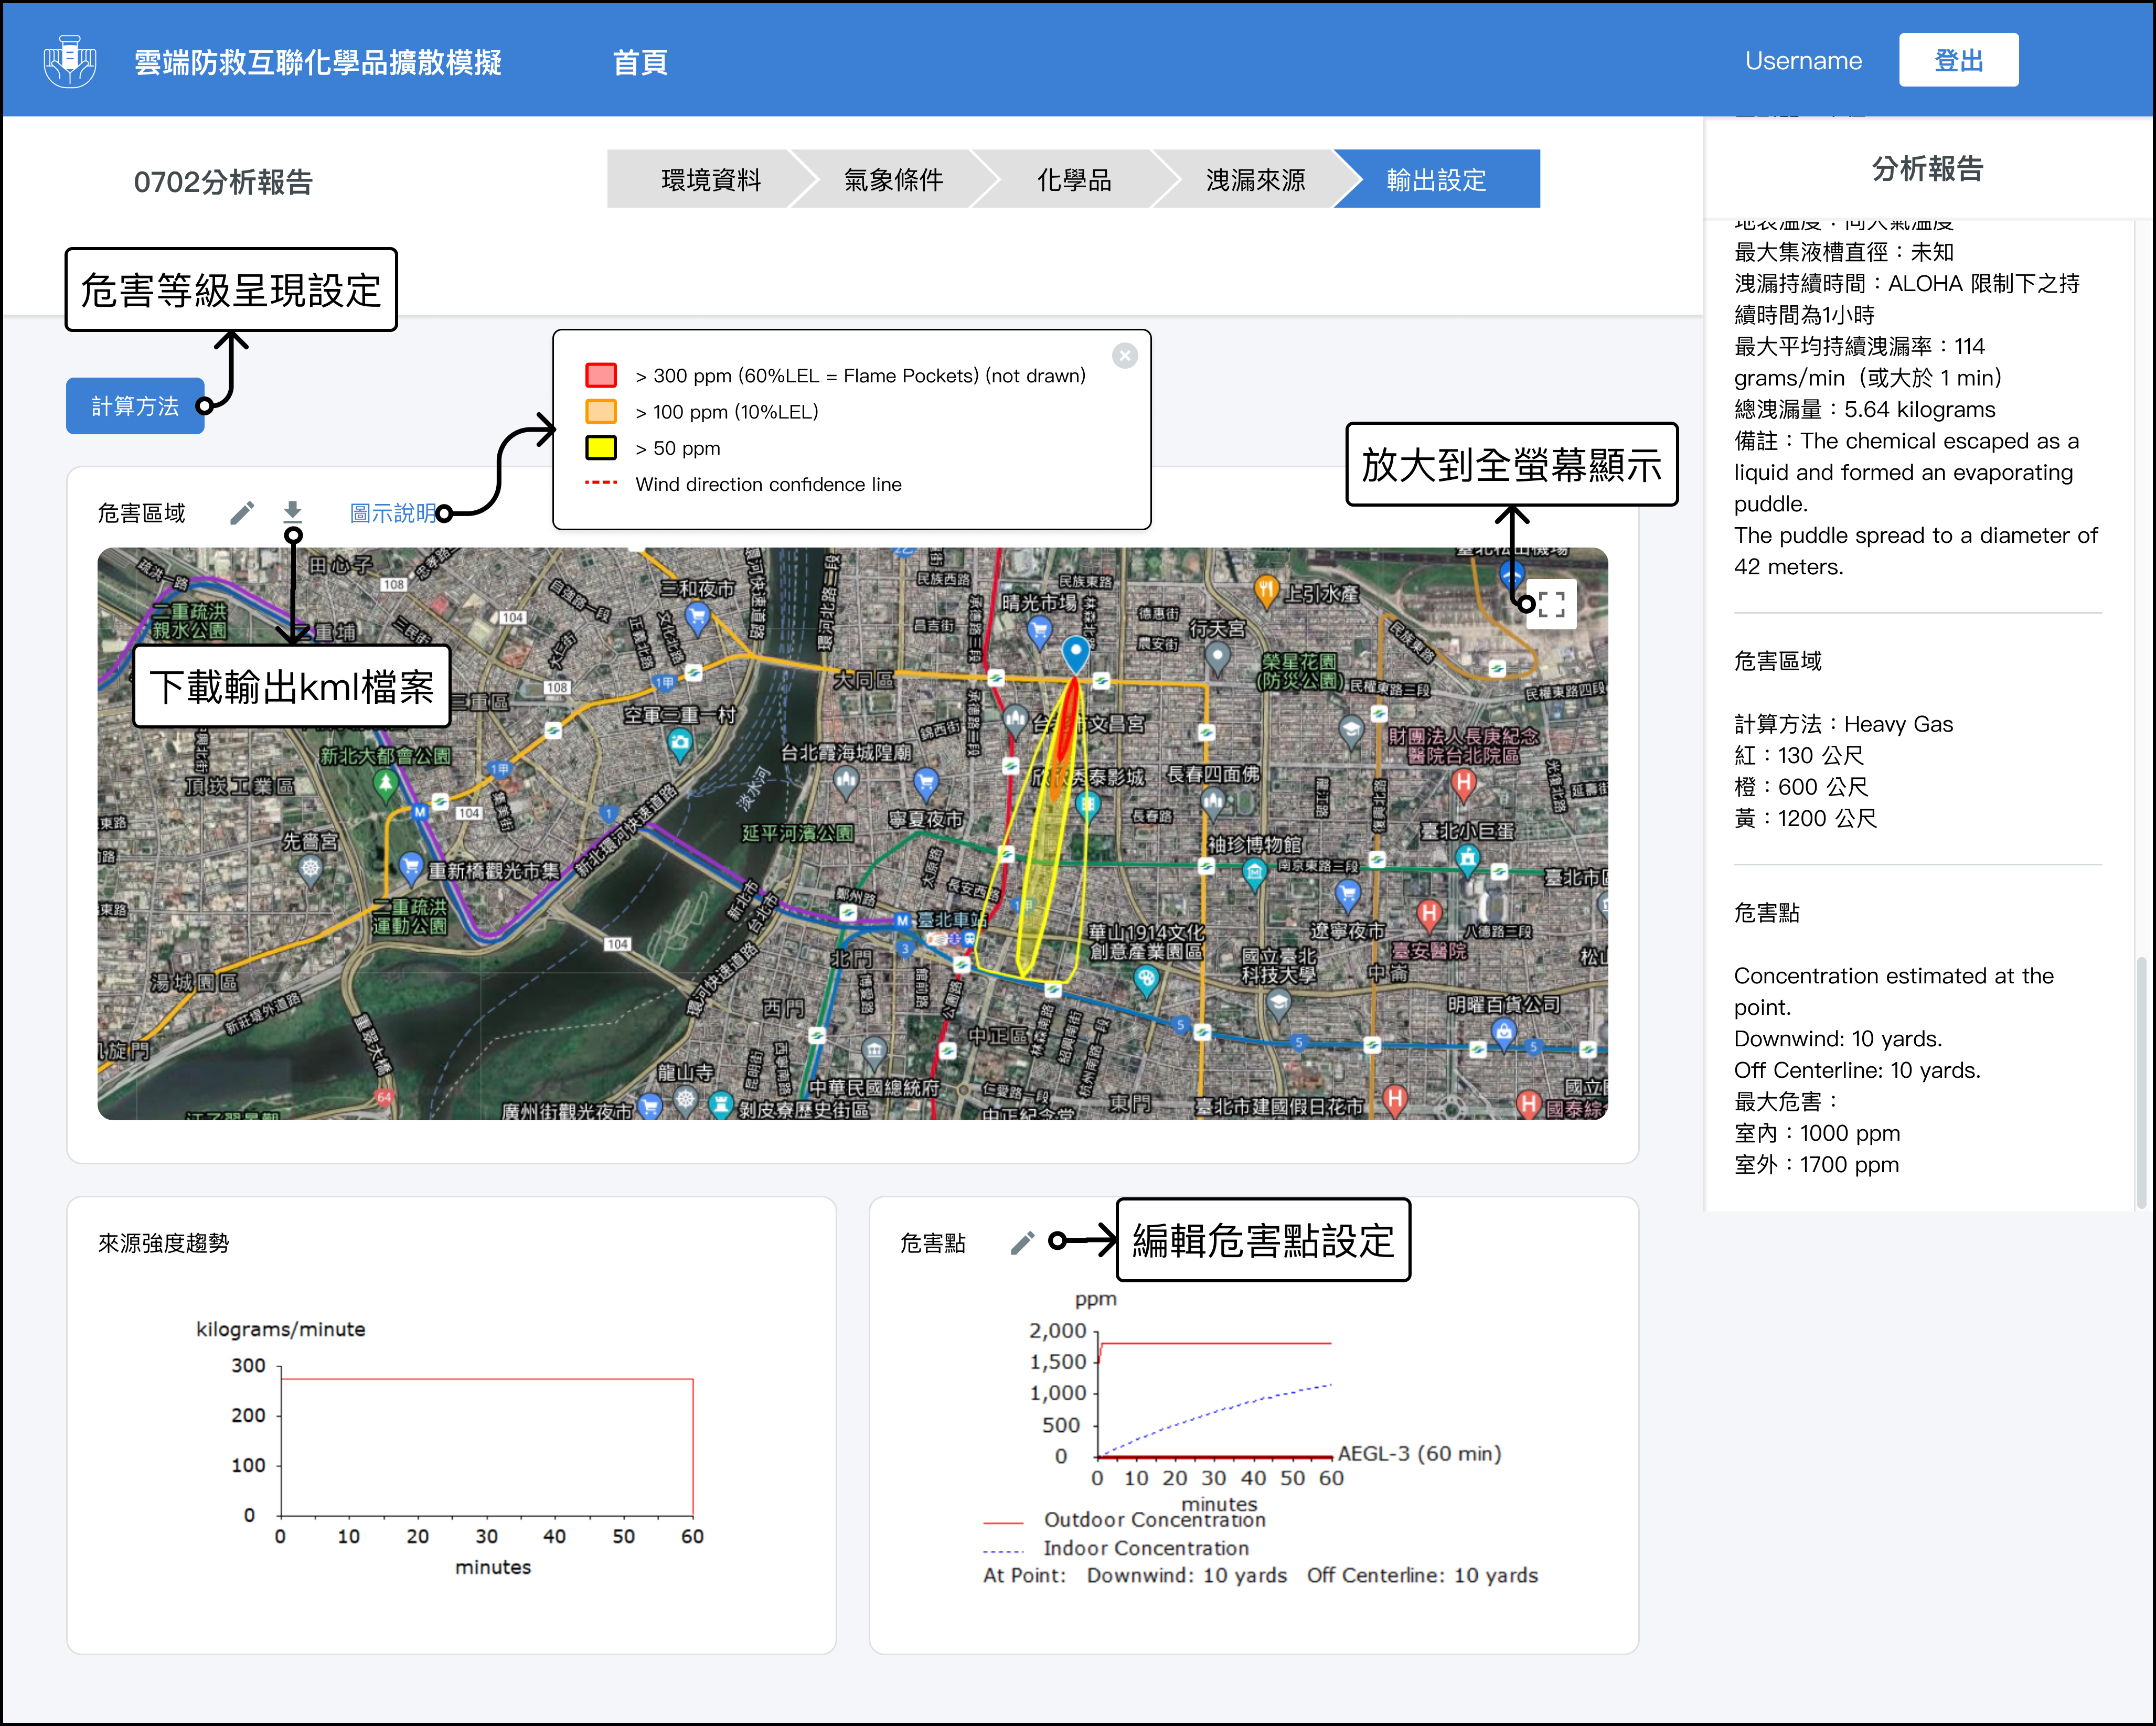
The dispersion modeling output result page.
Results and Feedback
During the whole project, we had a sprint review & planning meeting every 1-2 weeks with our client and had a quick stand-up meeting every morning to keep every teammate on the same page. This scrum development process effectively reduced communication barriers. Overall, our client was quite satisfied with the collaboration and the out-coming results. The project was still in the development stage, and we all look forward to the final MVP.
Next Project >>
All rights reserved © 2021 Astrid Lin